Charts | Online Help - Zoho CRM

Charts

Some of the options mentioned in this document are being released in a phased manner and may only be available to specific users.
The Dashboards tab is renamed as Analytics for selected accounts.

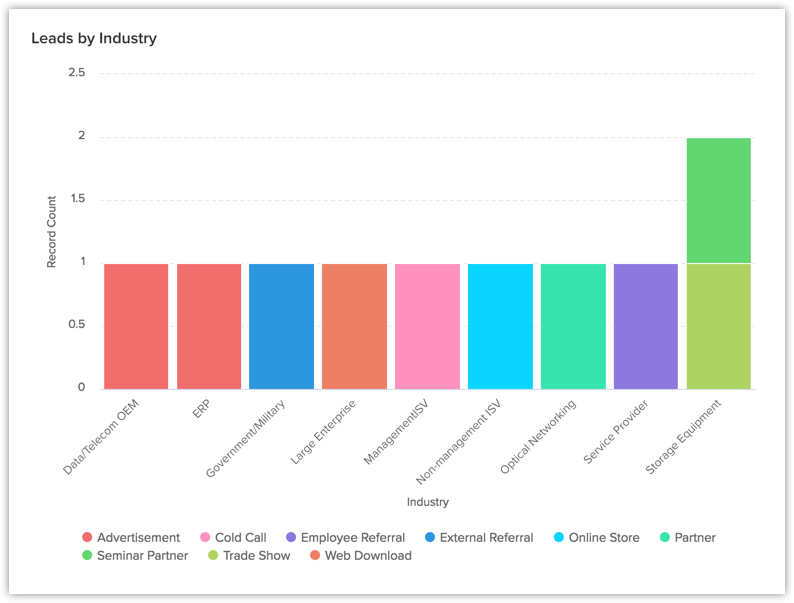
A chart presents data from various records of a module(s) in a visual or graphical representation for an easy analysis. The data is seemingly comprehensible as users can easily pick out the patterns, trends, etc., which may otherwise be difficult to interpret. For example, you are the Sales Manager for Asia Pacific region and want to compare the number of leads created by the sales representatives in the previous year. You can easily achieve this by creating charts in your dashboard and compare the number of leads created by different sales reps.

In Zoho CRM charts, you can:

  • Create different types of charts depending on your business requirement.
  • Present information in a graphical pattern that is more comprehensible.
  • Customize, reorder, and organize the charts in the dashboards.
  • Group data by day, calendar week, fiscal week, month, fiscal quarter, year, by fiscal year or fiscal quarter.

Based on your business requirement you can select from the below mentioned list of charts:

Chart TypeDescription
Bar chart & Horizontal chartTo display two or more kinds of data, that can be used to compare values across categories.
Line ChartTo display a trend over a period with the variations in the multiple values in a single chart.
Pie Chart & Donut ChartTo display data that is divided into triangular areas proportional to the percentages of the whole and used to illustrate the relationship of parts to the whole.
Table ChartTo show sum of the values in each category of the data.
Funnel ChartTo display different stages in a process and the associated data across categories  
Area ChartTo visually represent one or more quantities that change over time.

Create Chart Using Reports

You can create charts from the existing reports in your CRM account. The data from the selected report will be represented graphically. 

To create chart from reports

  1. Click the Dashboards tab.
  2. In the Dashboards page, select the dashboard in which the chart has to be added.
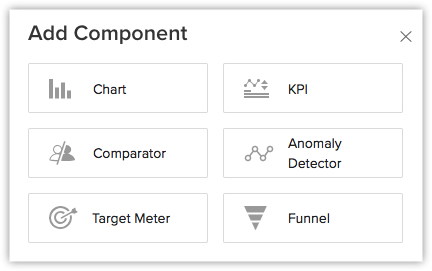
  3. Click Add Component.
  4. In the Add Component page, click the Chart.
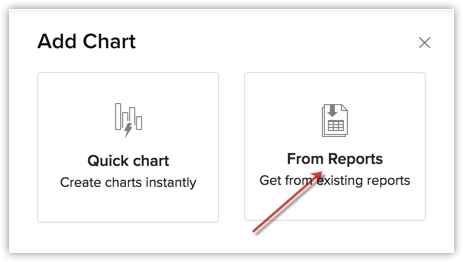
  5. In the Add Chart page, choose From Reports.
  6. In the  Add Chart page, do the following:
    • Enter the component name.
    • Select a report from Report drop-down list.
    • Select an option, in the Measure (Y-axis) and Grouping,from the list of available components.
    • Click More Options to choose Sort by, Maximum grouping, Benchmark for y-axis, and Display as shortened numbers..
    • In the top right, you can select the desired chart type using the drop-down list.
  7. Click Save, to add the component to Dashboard.
  8. Click the Add & Reorder to add and rearrange the components.

For charts created from reports, the report name will be mentioned and linked at the bottom of the chart component for reference.

Create Chart Using Quick Chart

In quick charts you can create charts by defining your own metrics, based on which the data will be represented in a graphical manner. 

You can also view the total number of records by clicking on any single bar in the chart. 

To create chart from quick chart

  1. In the Add Chart page, click Quick Chart.
  2. In the next page that appears, do the following:
    • Enter the component name.
    • Select the Module and the related module for the chart from the drop down list.
    • Select an option in the Measure (Y-axis) and Grouping fields from the list of available components.
    • Click Criteria Filter to further specify the criteria for filtering records.
      You can add up to 10 criteria.
    • Click the More Options to select Sort by, Maximum grouping, Benchmark for y-axis, and Display as shortened numbers.
    • Select the Chart type from the drop-down list.
  3. Click Save.
  4. Click Add & Reorder to save the chart in a dashboard and to rearrange it instantly.


Note
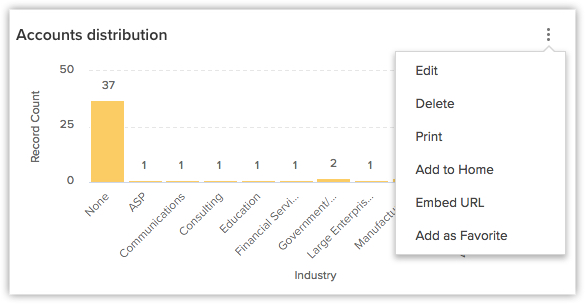
  1. You can Clone, Edit, Delete, Print, Add to Home, Embed URL or Add a chart to favourite by clicking on the More icon in a component.
  2. If the charts are grouped using one field then 75 groupings (that is, bars, lines, sectors etc.) will be displayed in a graph. If, two fields are used to group data, then 150 groupings will be shown in a single graph.
  3. When you enable Display as shortened numbers, you can choose the format (for example, display thousands as K) and decimal places. If you've chosen the format as Millions (M) and decimal places as 2, the number 135,532,000 will be displayed as 135.53 M.
    1. Supported formats are:
      Thousands (K)
      Millions (M)
      Billions (B)
      Lakhs (L)
      Crores (C)
    2. Number of decimal places supported are: 0, 1, 2, and 3.
  4. Along with viewing unconverted leads, you can also view converted leads based on analytical components from the Leads module. Utilize the "Is Converted" field in the filters to display both converted and unconverted leads with the criteria "Is Converted is Selected" and "Is Converted is Not Selected" respectively.
  5. For date/time, currency, number-related, roll-up summaries, and checkbox fields: You can filter records either based on specific values or by comparing with a similar field.

Zia's Suggestions for Charts

Zia will analyze your data and provide the most appropriate recommendations for creating chart components, tailored to your organization's needs and business processes.


Upon choosing a suggestion, you have the option to modify the configuration if needed or go with the suggested configuration for creating the chart component.

Notes:
  1. A maximum of 10 suggestions will be available.

SEE ALSO


    Zoho CRM Training Programs

    Learn how to use the best tools for sales force automation and better customer engagement from Zoho's implementation specialists.

    Zoho CRM Training
      Redefine the way you work
      with Zoho Workplace

        Zoho DataPrep Personalized Demo

        If you'd like a personalized walk-through of our data preparation tool, please request a demo and we'll be happy to show you how to get the best out of Zoho DataPrep.

        Zoho CRM Training

          Create, share, and deliver

          beautiful slides from anywhere.

          Get Started Now


            Zoho Sign now offers specialized one-on-one training for both administrators and developers.

            BOOK A SESSION


                                    You are currently viewing the help pages of Qntrl’s earlier version. Click here to view our latest version—Qntrl 3.0's help articles.


                                        Manage your brands on social media

                                          Zoho Desk Resources

                                          • Desk Community Learning Series


                                          • Digest


                                          • Functions


                                          • Meetups


                                          • Kbase


                                          • Resources


                                          • Glossary


                                          • Desk Marketplace


                                          • MVP Corner


                                          • Word of the Day


                                            Zoho Marketing Automation

                                              Zoho Sheet Resources


                                                  Zoho Forms Resources


                                                    Secure your business
                                                    communication with Zoho Mail


                                                    Mail on the move with
                                                    Zoho Mail mobile application

                                                      Stay on top of your schedule
                                                      at all times


                                                      Carry your calendar with you
                                                      Anytime, anywhere


                                                            Zoho Sign Resources

                                                              Sign, Paperless!

                                                              Sign and send business documents on the go!

                                                              Get Started Now


                                                                      Zoho TeamInbox Resources


                                                                              Zoho DataPrep Resources


                                                                                Zoho DataPrep Demo

                                                                                Get a personalized demo or POC

                                                                                REGISTER NOW


                                                                                  Design. Discuss. Deliver.

                                                                                  Create visually engaging stories with Zoho Show.

                                                                                  Get Started Now


                                                                                                      • Related Articles

                                                                                                      • FAQs: Chart View

                                                                                                        CRM for Everyone is in the Restricted Early Access mode and is available only to a select set of users upon request. Please refrain from posting about this publicly. What is a Chart view in Zoho CRM? Chart view presents data visually using formats ...
                                                                                                      • What are the different Gantt chart views that can be created?

                                                                                                        You have two Gantt charts to choose from: The Chronology Gantt view, which gives a visual perspective to the Tasks module. The Milestone Gantt view, which lets you view the milestones, task lists, and tasks on the left and the corresponding bars on ...
                                                                                                      • Analytical Components - Overview

                                                                                                        Zoho CRM provides different types of analytics components for user dashboards. The list of components that the users can choose from is: Charts - Chart is a graphic representation of the user's data. It gives quick insights into records for easy ...
                                                                                                      • Segmentation Analysis

                                                                                                        Segmentation Analysis is a set of dashboards that groups VoC insights on the basis of customer segmentation settings in your CRM account. This dashboard presents five charts and are as follows. The Segmentation Analytics category on VoC is designed ...
                                                                                                      • VoC Dashboards in Zoho CRM — A Detailed Study

                                                                                                        VoC Dashboards — An Overview The insights on VoC are presented in the form of various dashboards under specific categories. In order to understand these insights and use them to make informed decisions you must learn what the various types of ...
                                                                                                        Wherever you are is as good as
                                                                                                        your workplace

                                                                                                          Resources

                                                                                                          Videos

                                                                                                          Watch comprehensive videos on features and other important topics that will help you master Zoho CRM.


                                                                                                          eBooks

                                                                                                          Download free eBooks and access a range of topics to get deeper insight on successfully using Zoho CRM.


                                                                                                          Webinars

                                                                                                          Sign up for our webinars and learn the Zoho CRM basics, from customization to sales force automation and more.


                                                                                                          CRM Tips

                                                                                                          Make the most of Zoho CRM with these useful tips.


                                                                                                            Zoho Show Resources