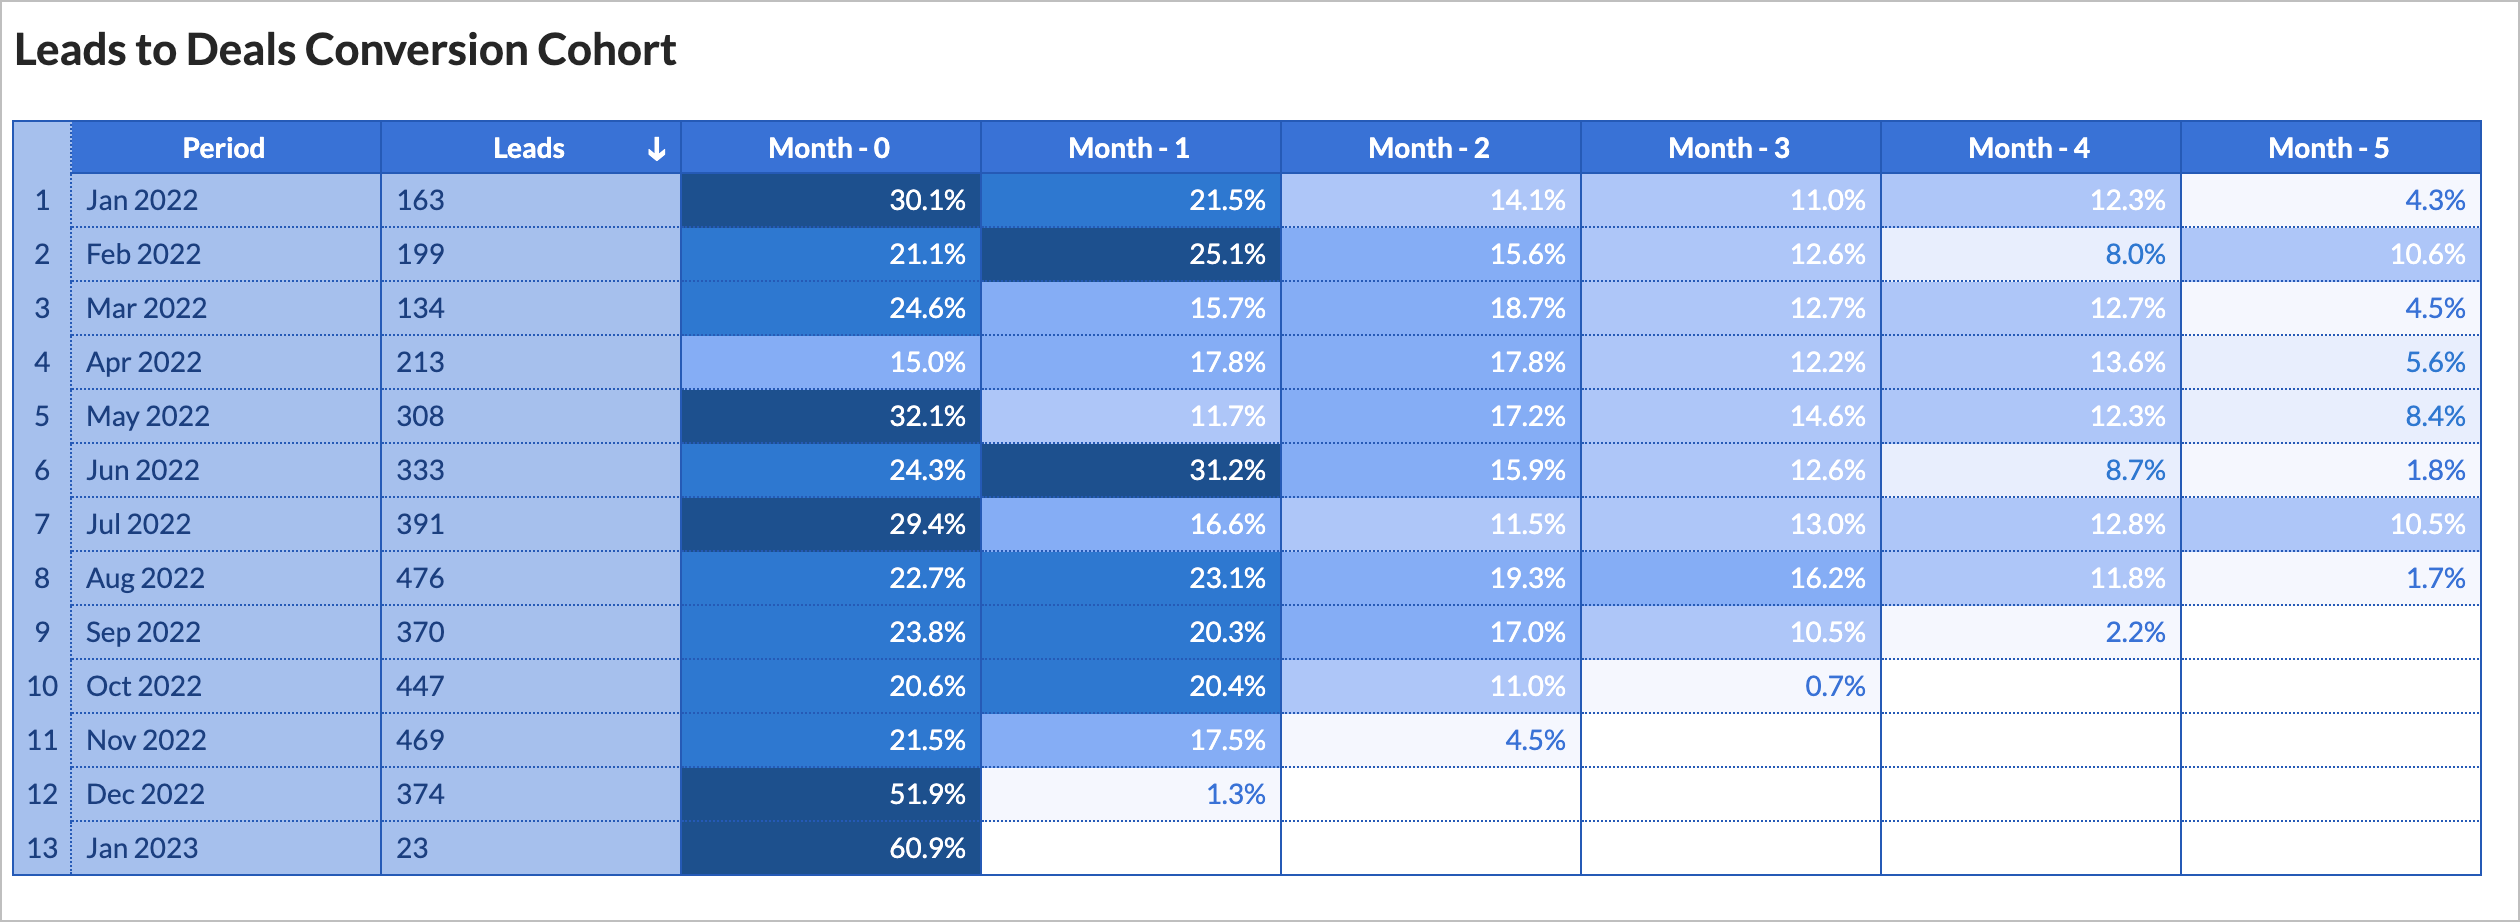
Report of the Week - Leads to Deals Conversion Cohort

- Lead Conversion Percent Report using Formula Column
- Lead Conversion Cohort Analysis using Query Tables
Lead Conversion Percent using Formula Column
|
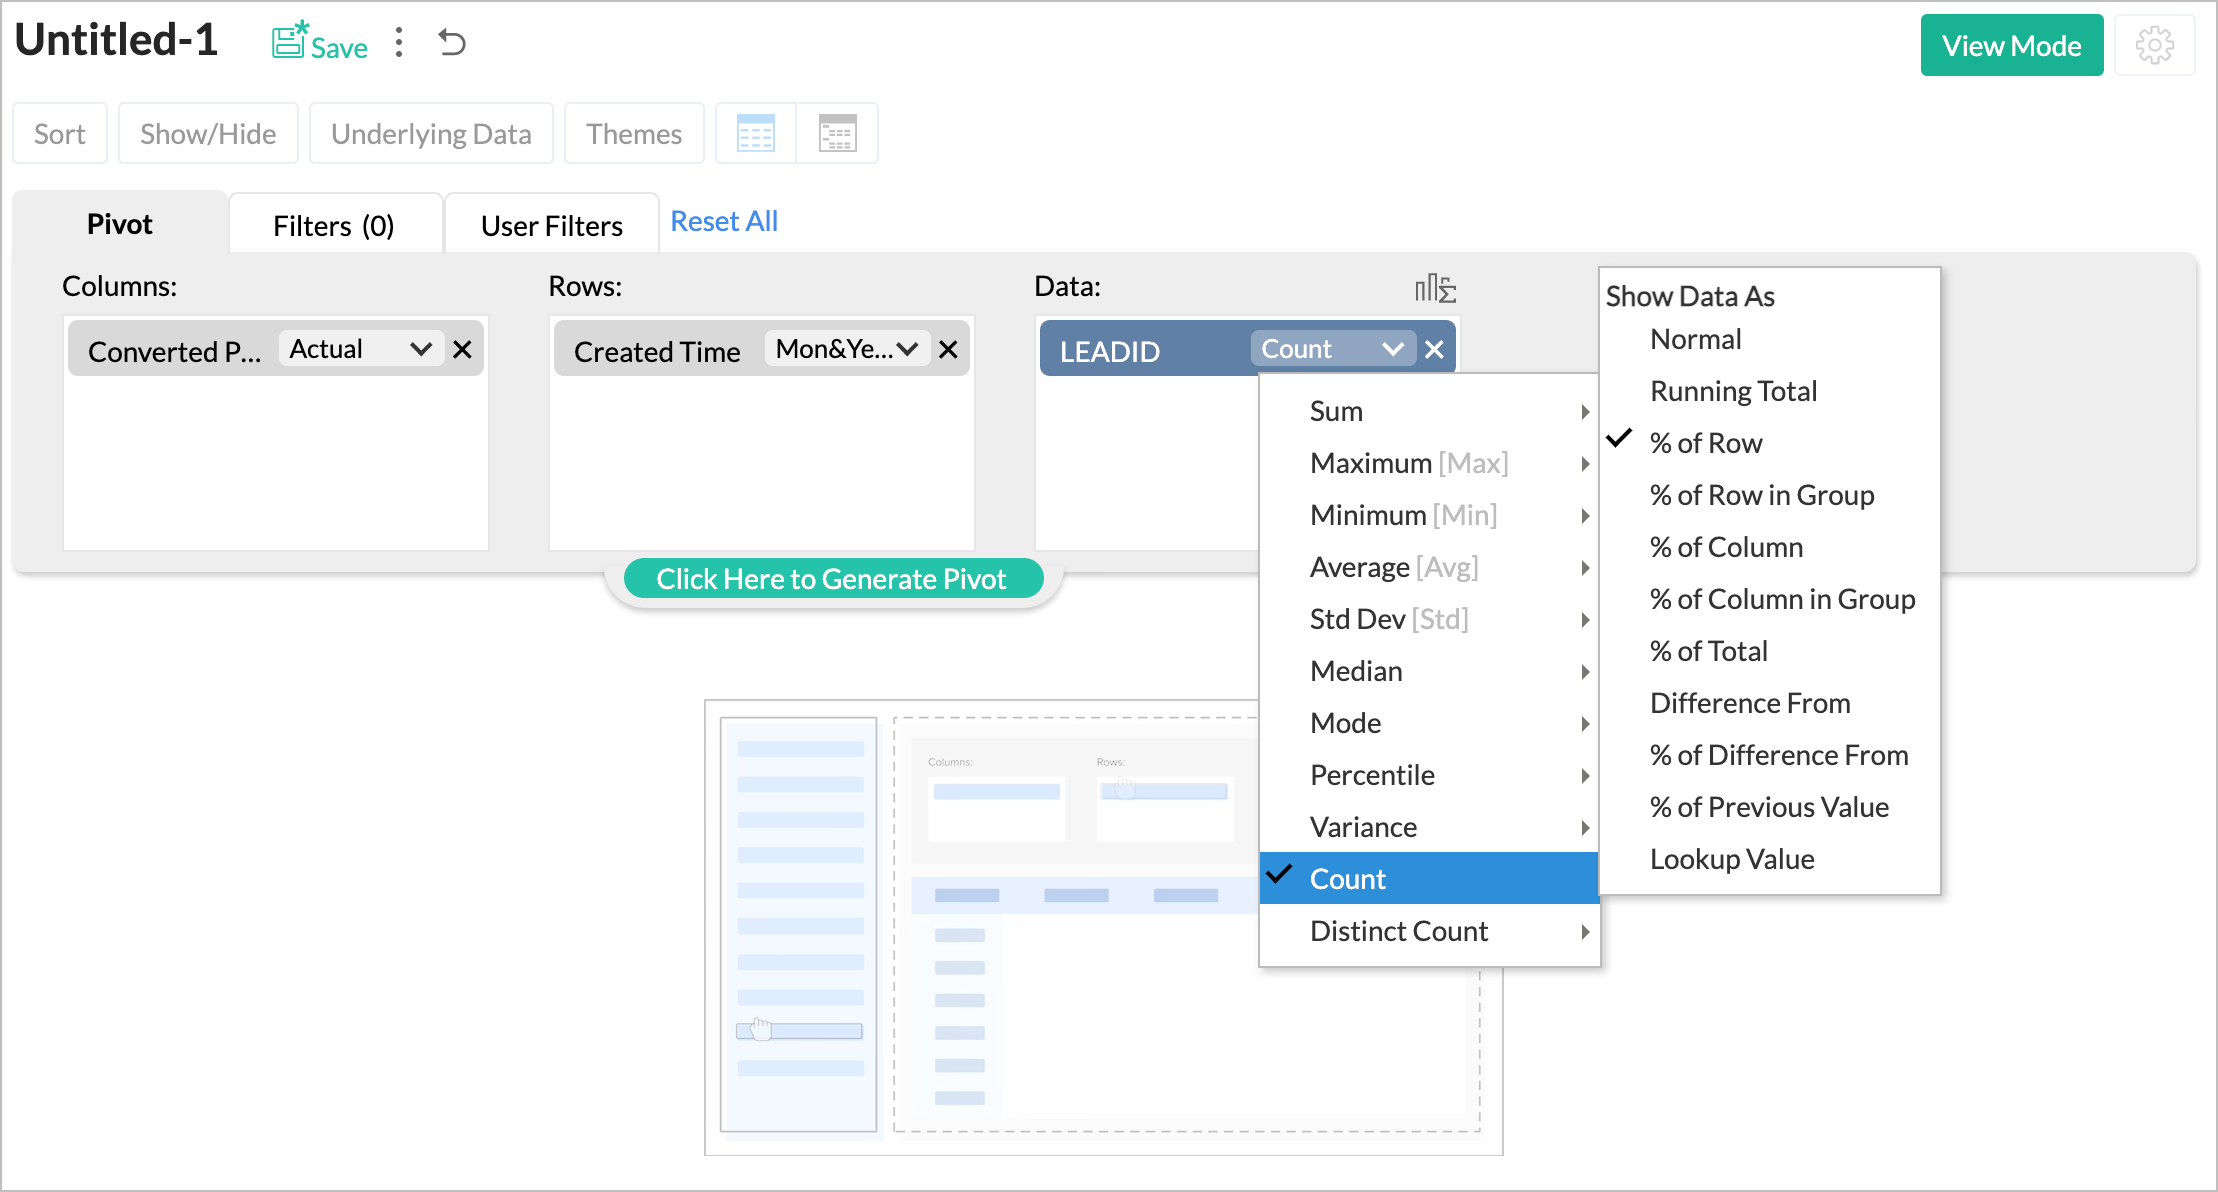
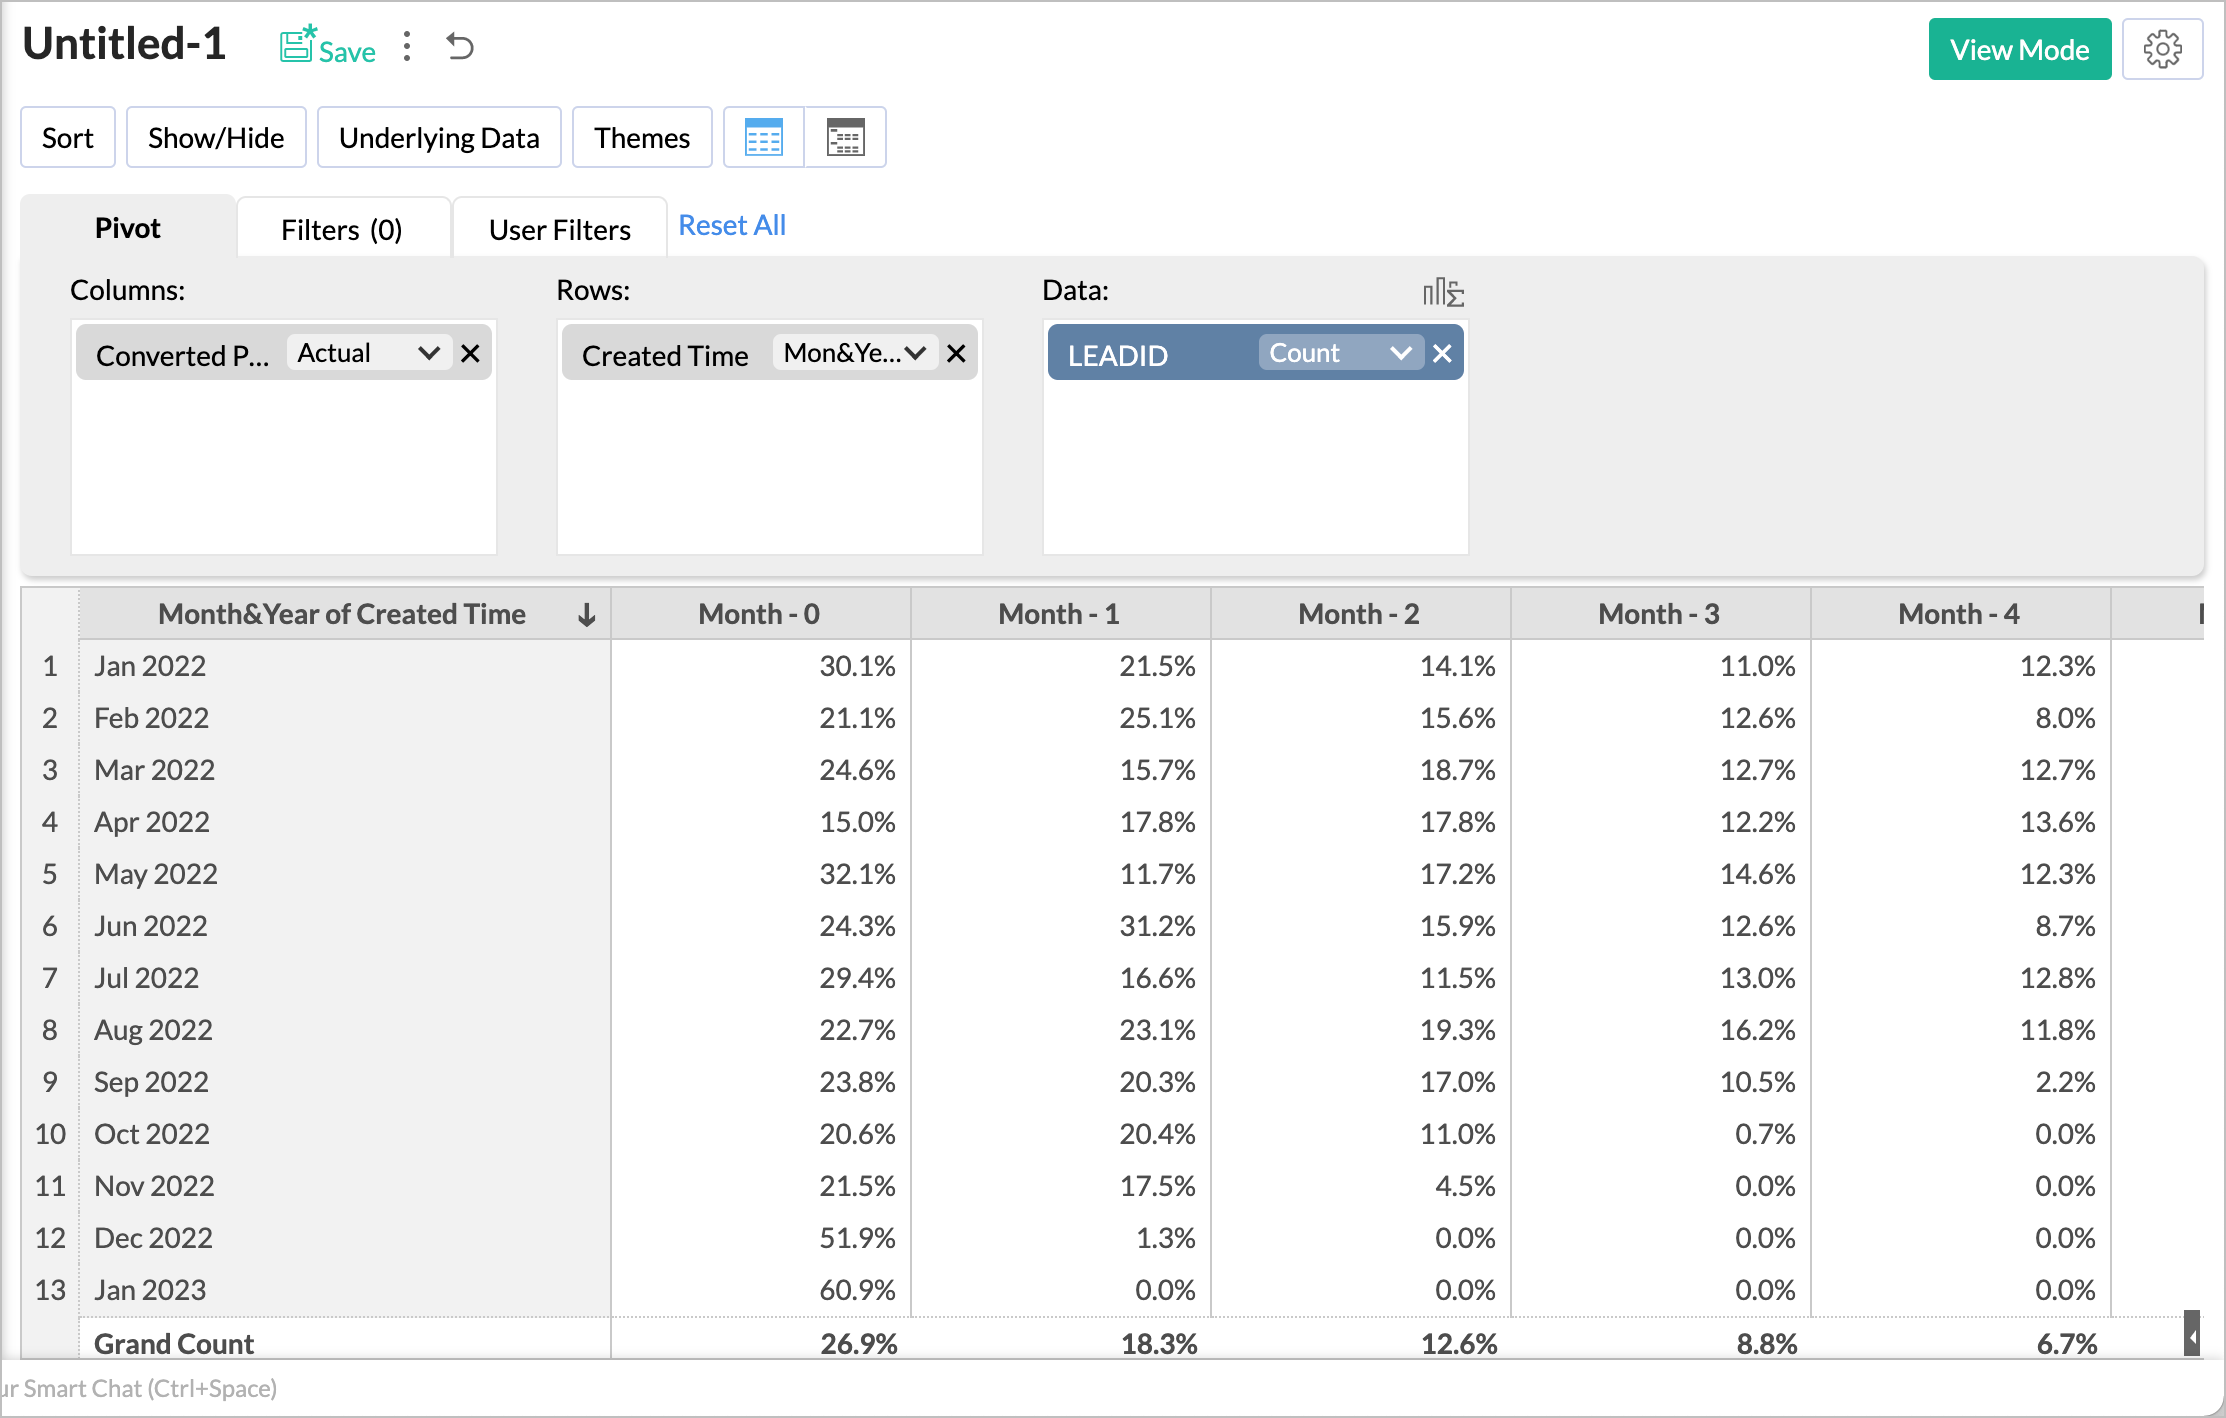
- Open Pivot Designer over the Leads table.
- Add the columns as follows.
- Columns: Converted Period formula column with Actual.
- Rows: Created Time with Month & Year .
- Data: LEADID with Count > % of Row.
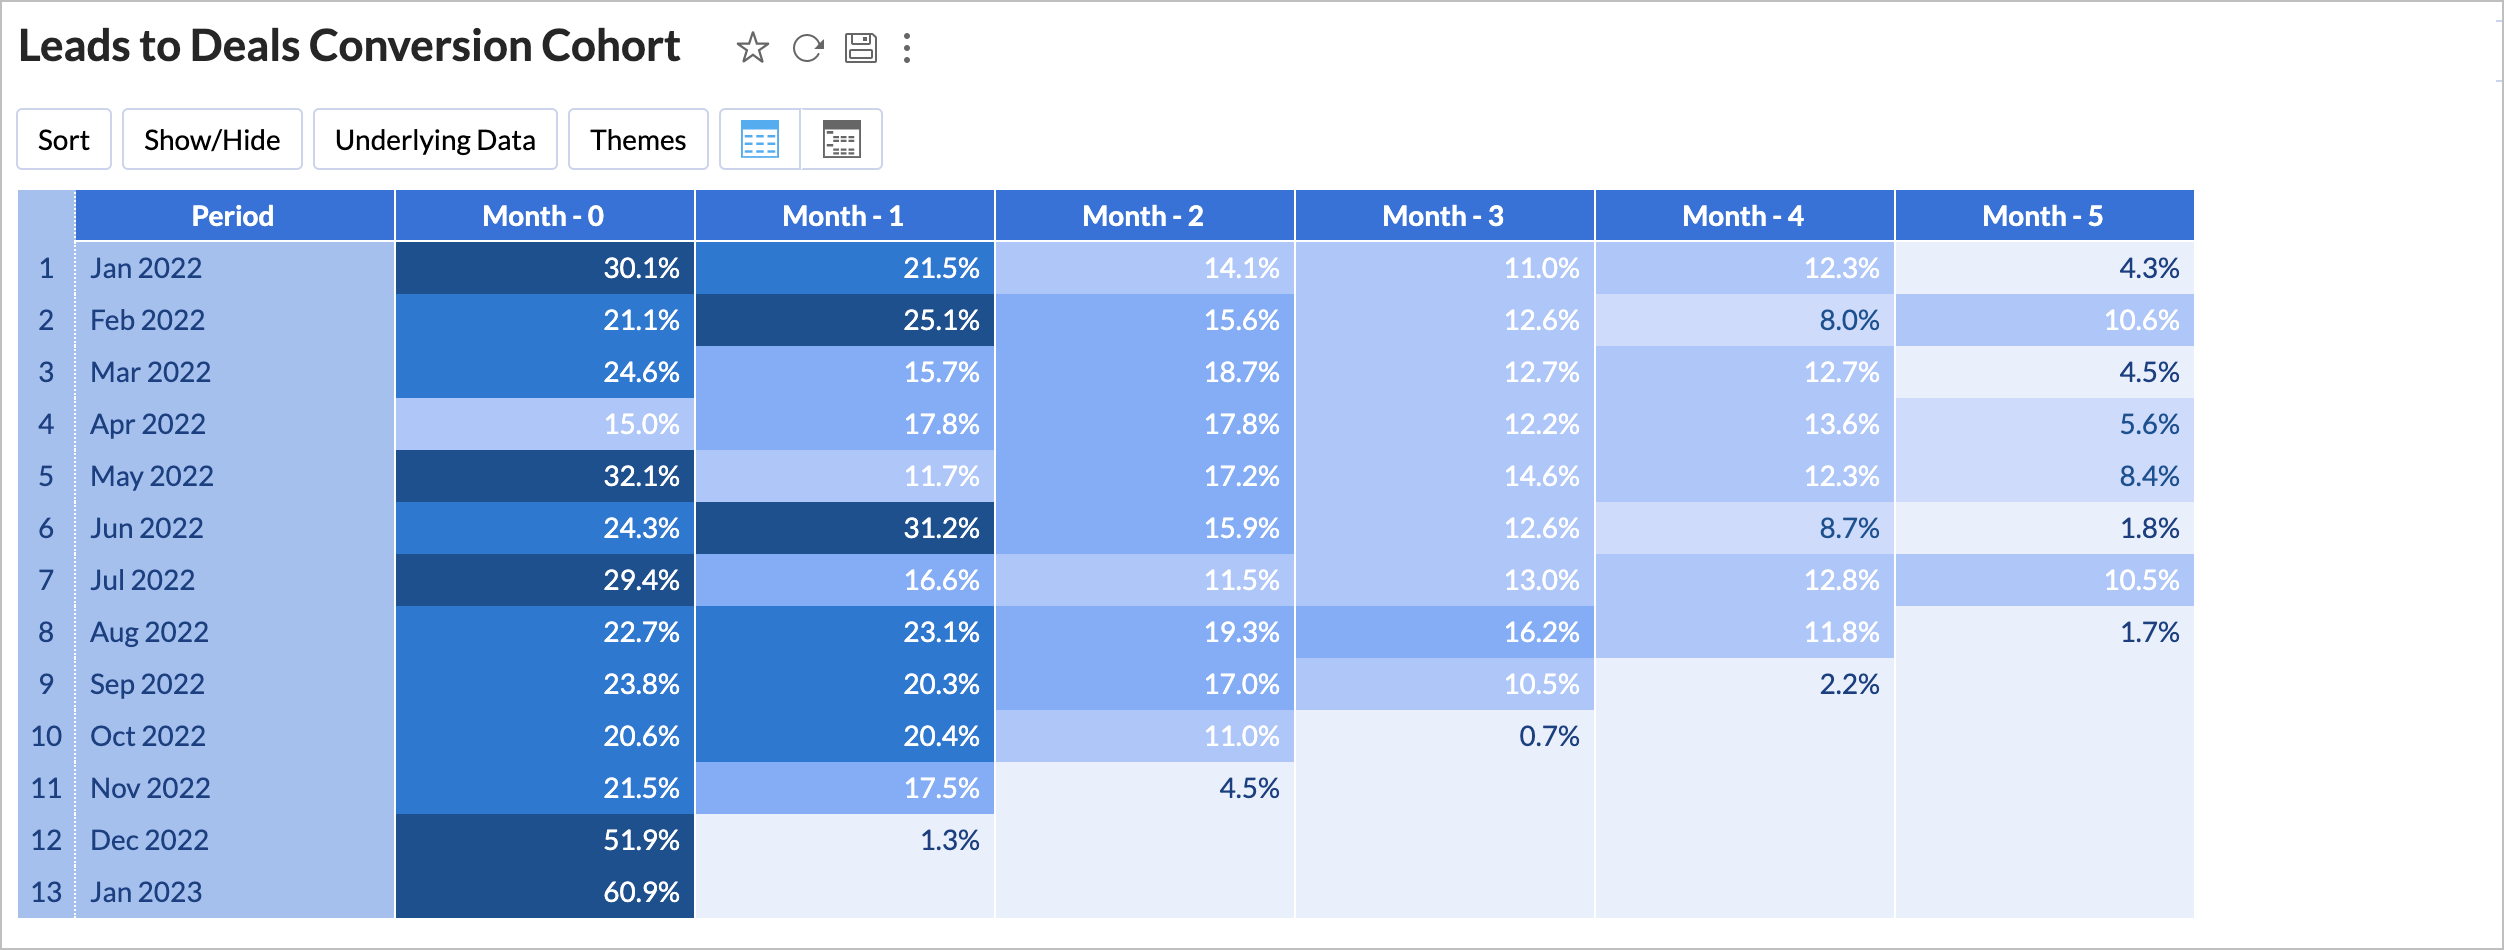
- The pivot will be generated as shown below. Hide the total.
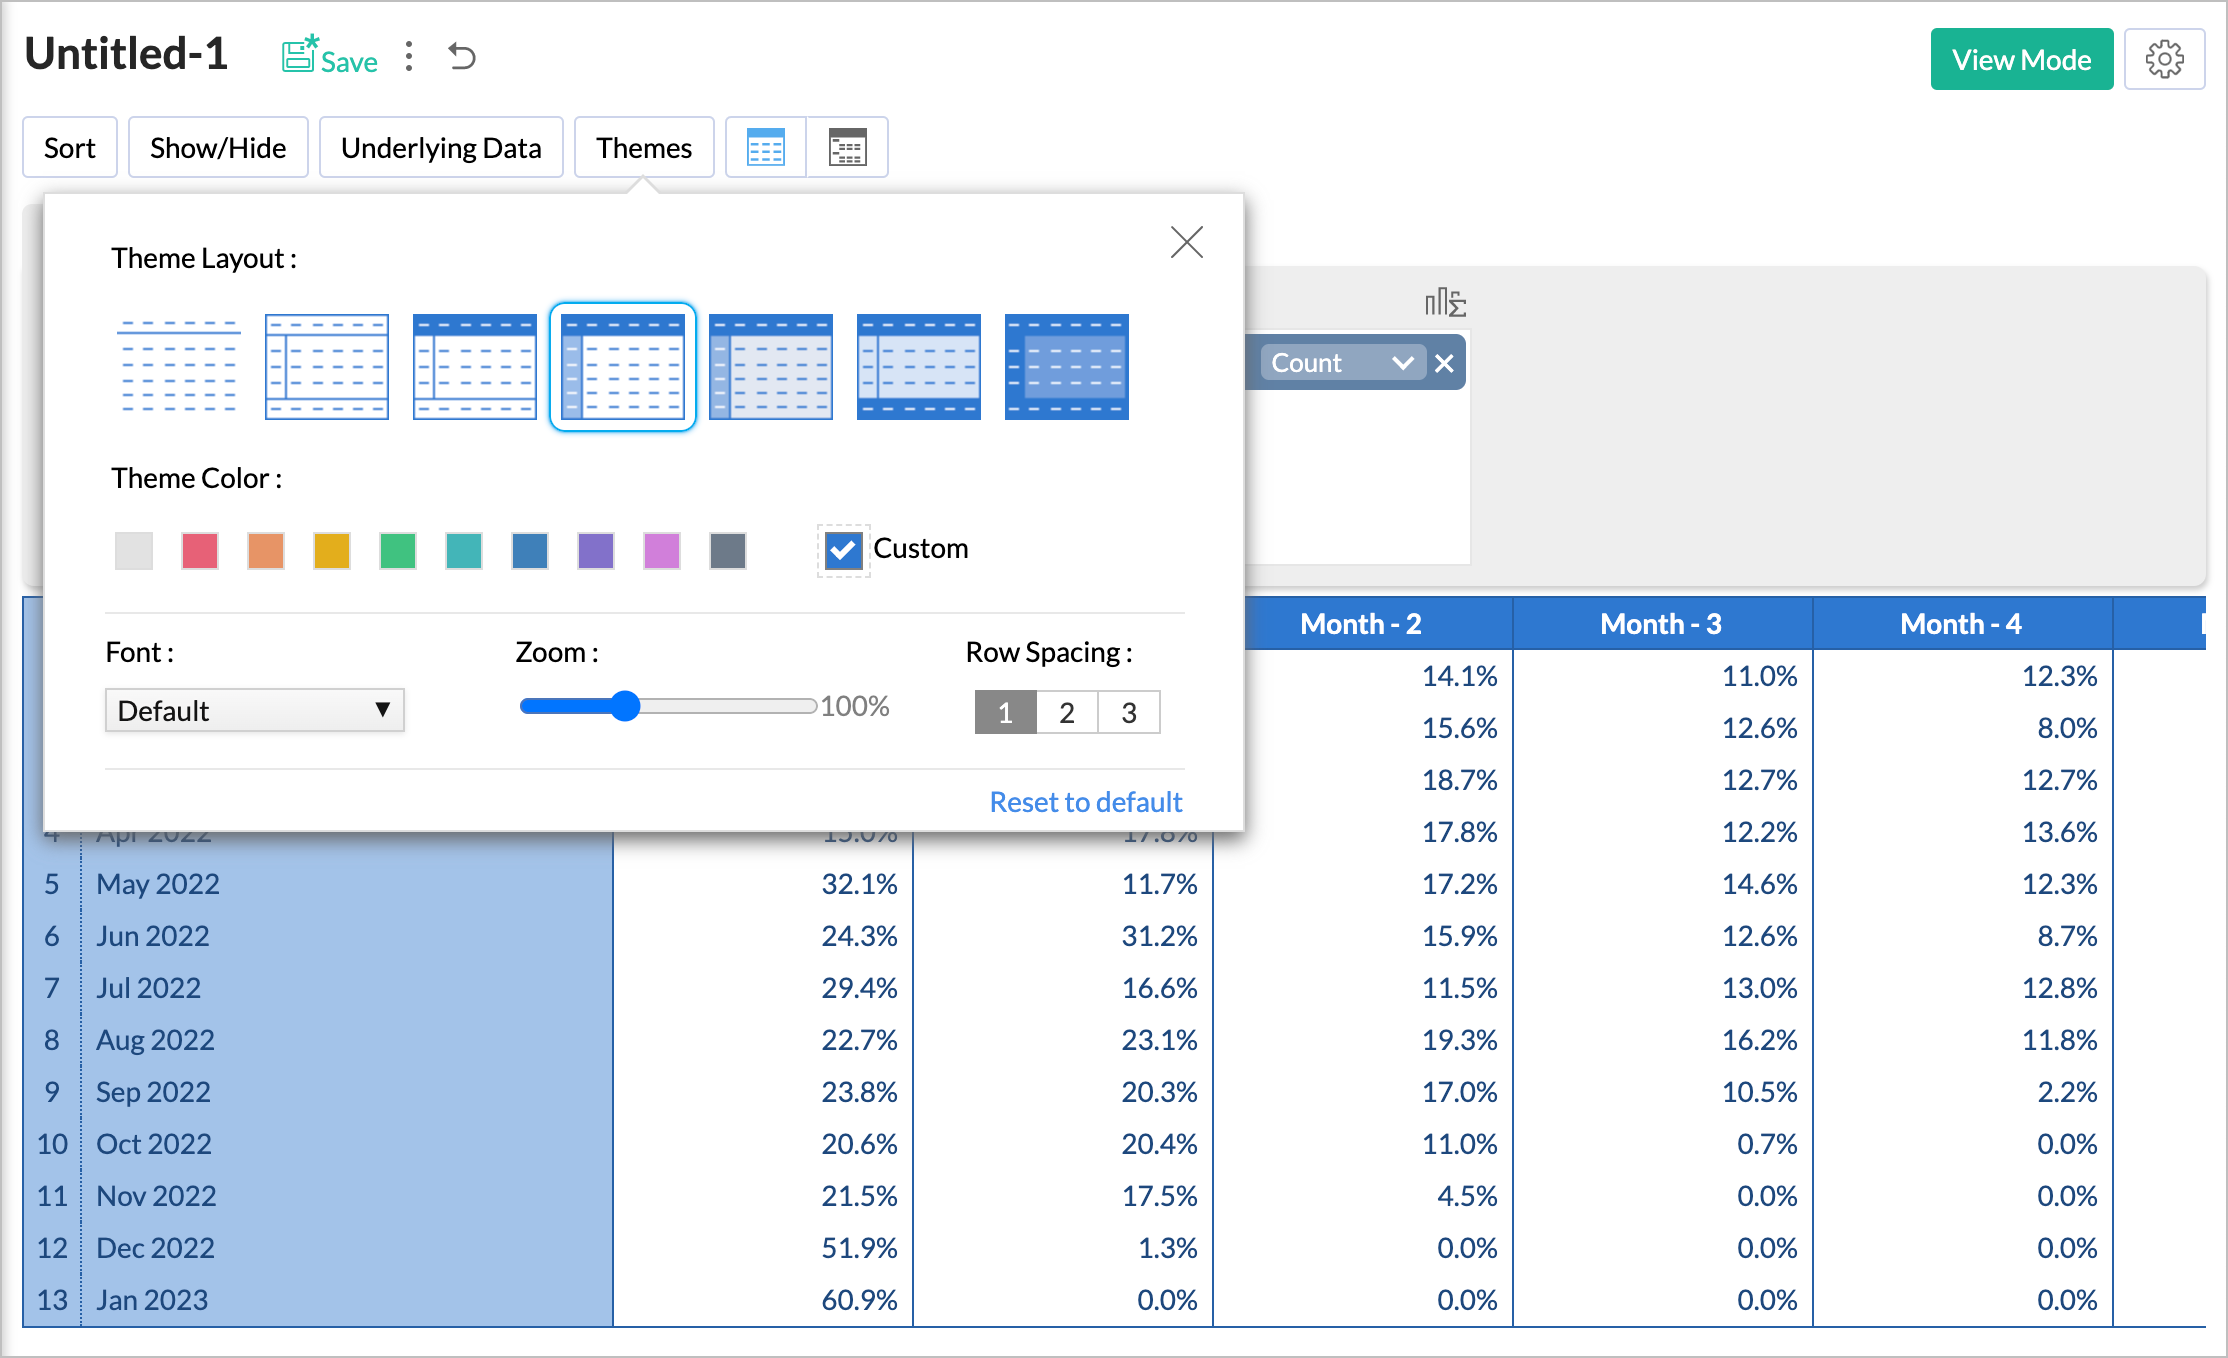
- Apply Theme.
- You can apply Conditional Formatting to highlight the conversion trend. Lead conversion rates vary across industries. Specify the conditions as per your industry's standard.
Lead Conversion Cohort using Query Tables
- Query Table: Leads Tracking
- Query Table: Leads Count - Month & Year wise
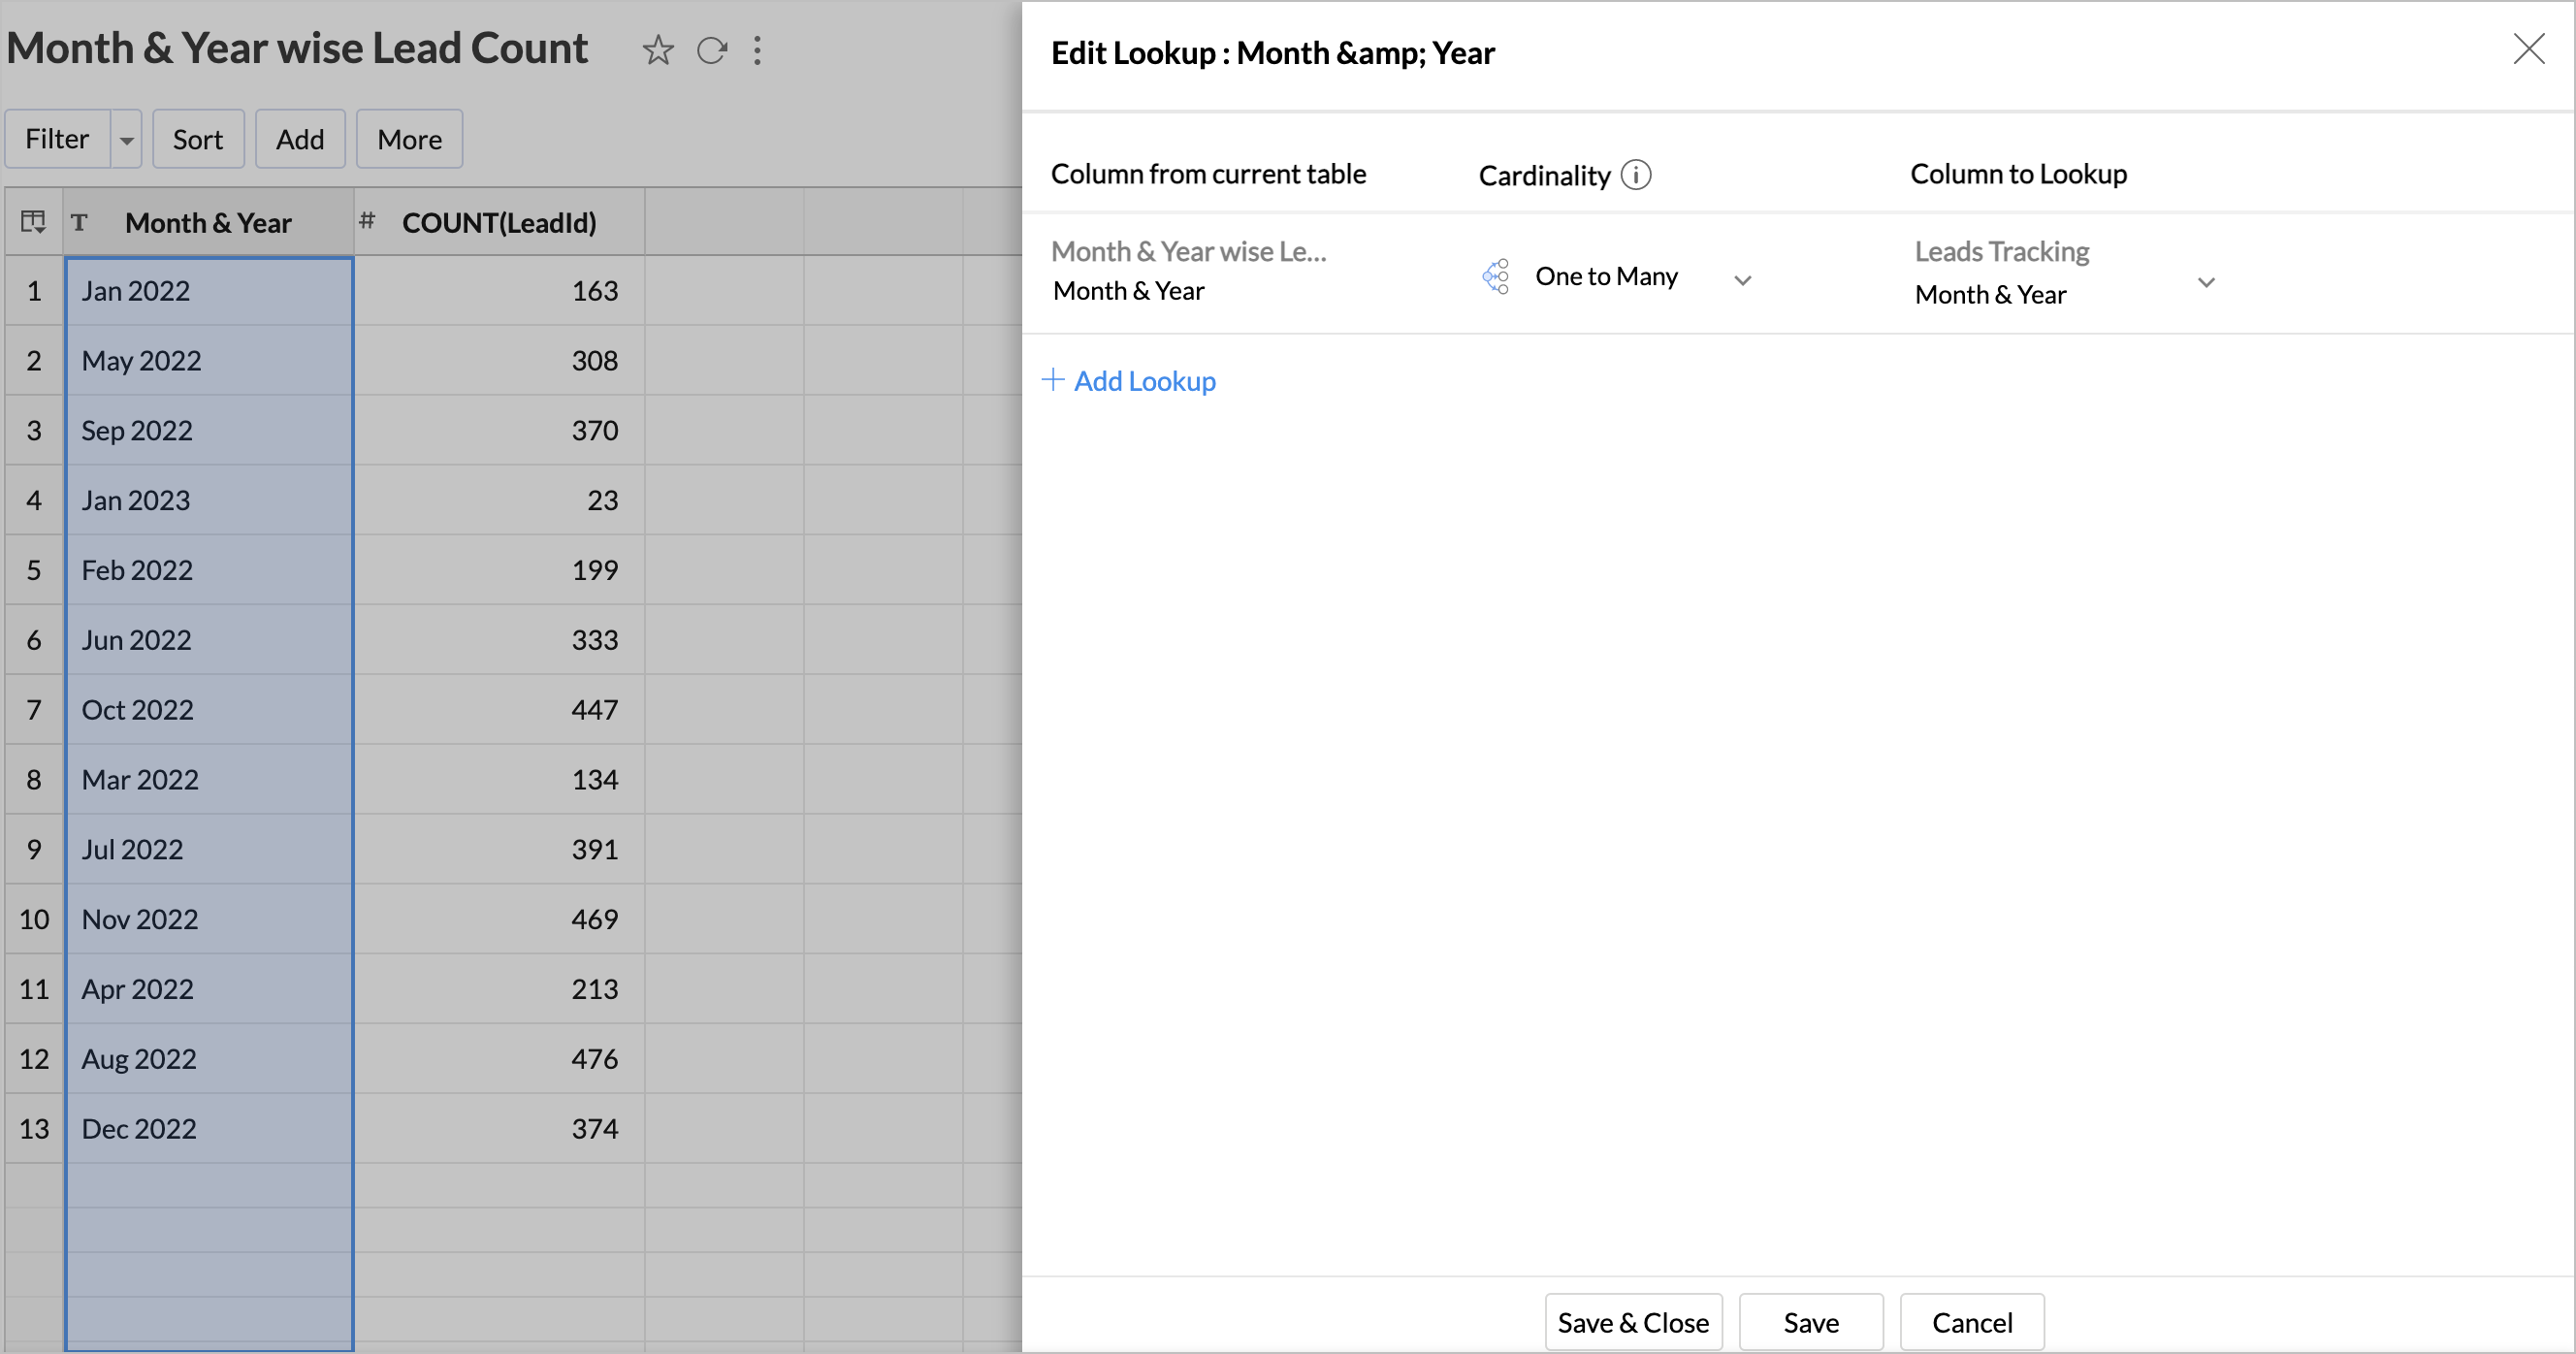
- Join Query Tables
- Creating Leads Conversion Cohort
Query Table: Leads Tracking
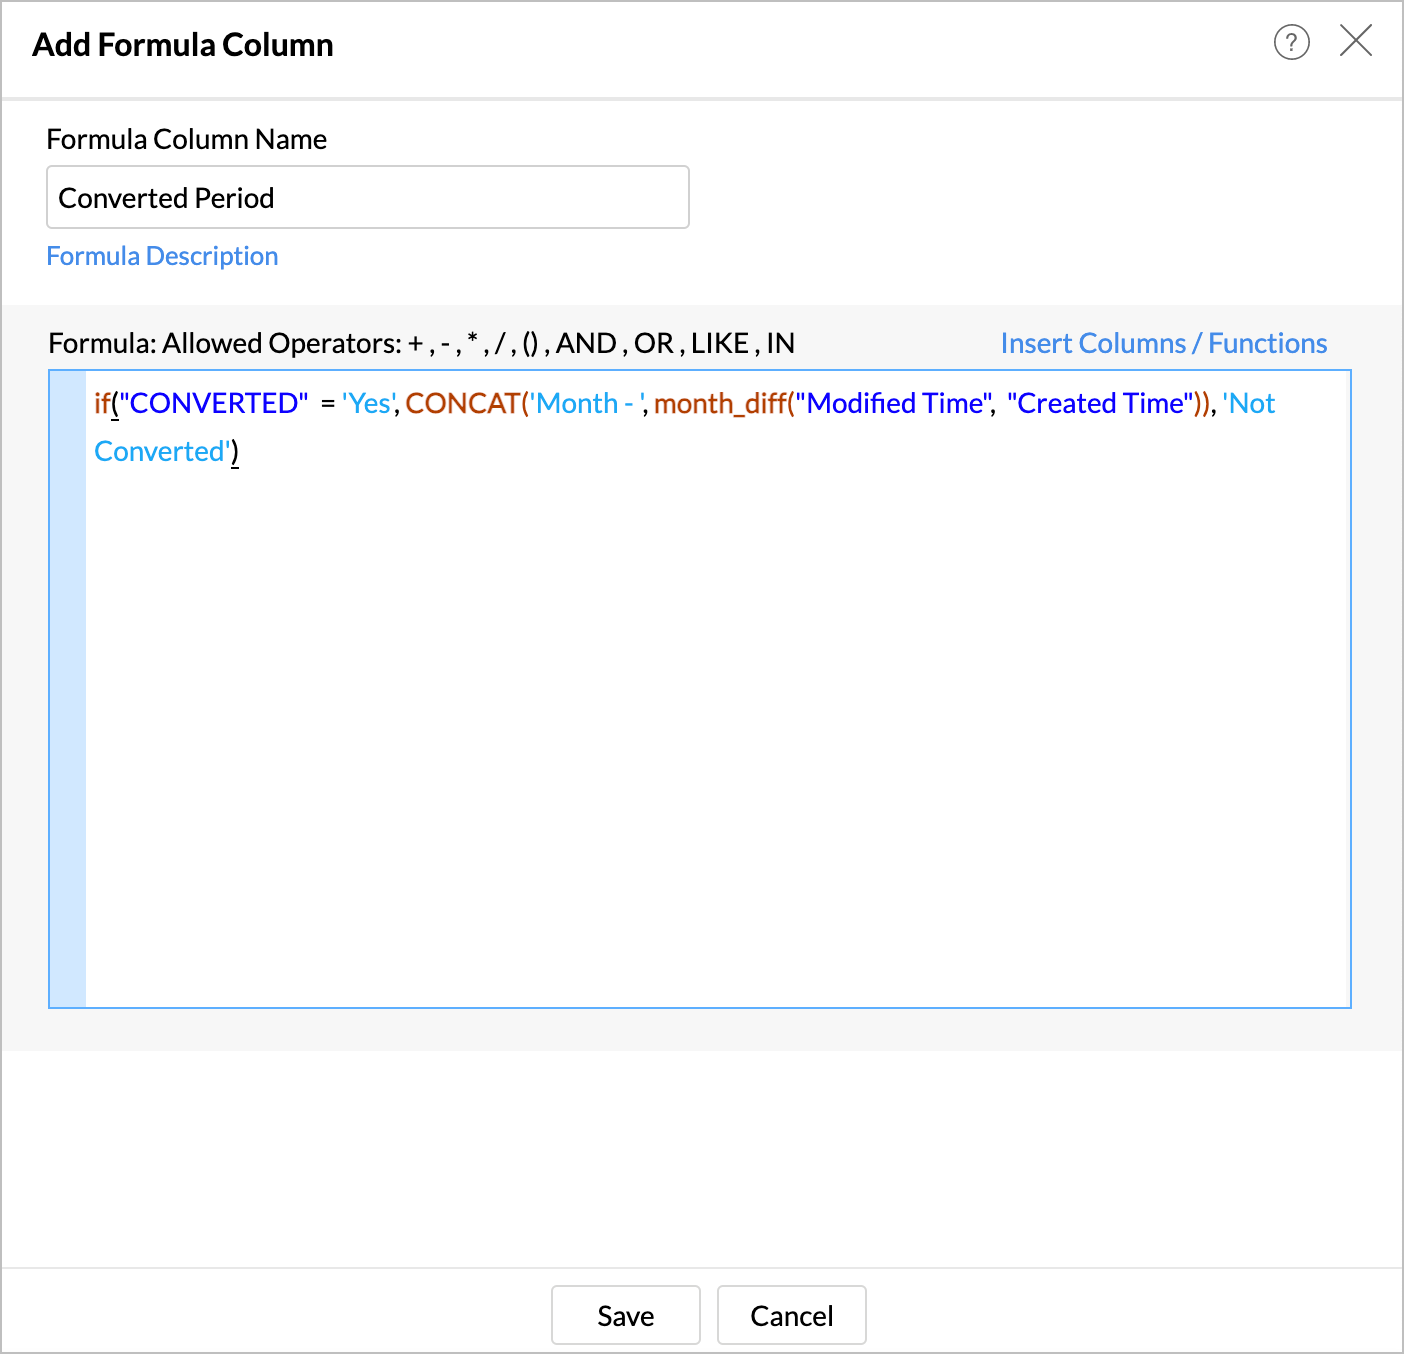
SELECT *, /*Gets all columns form Leads table*/ CONCAT(LEFT(MONTH_NAME("Created Time"), 3), ' ', YEAR("Created Time")) "Month & Year", /*Gets the month and year of created time as a group to calculate the leads for each month*/ if("CONVERTED" = 'Yes', CONCAT('Month - ', period_diff(date_format("Modified Time", '%Y%m'), date_format("Created Time", '%Y%m'))), 'Not Converted') "Month Diff" FROM "Leads" /*Identifies whether a lead is converted or not and groups them based on how long it takes to get converted. This period is assumed based on the time difference between lead created and last modified time. */
|

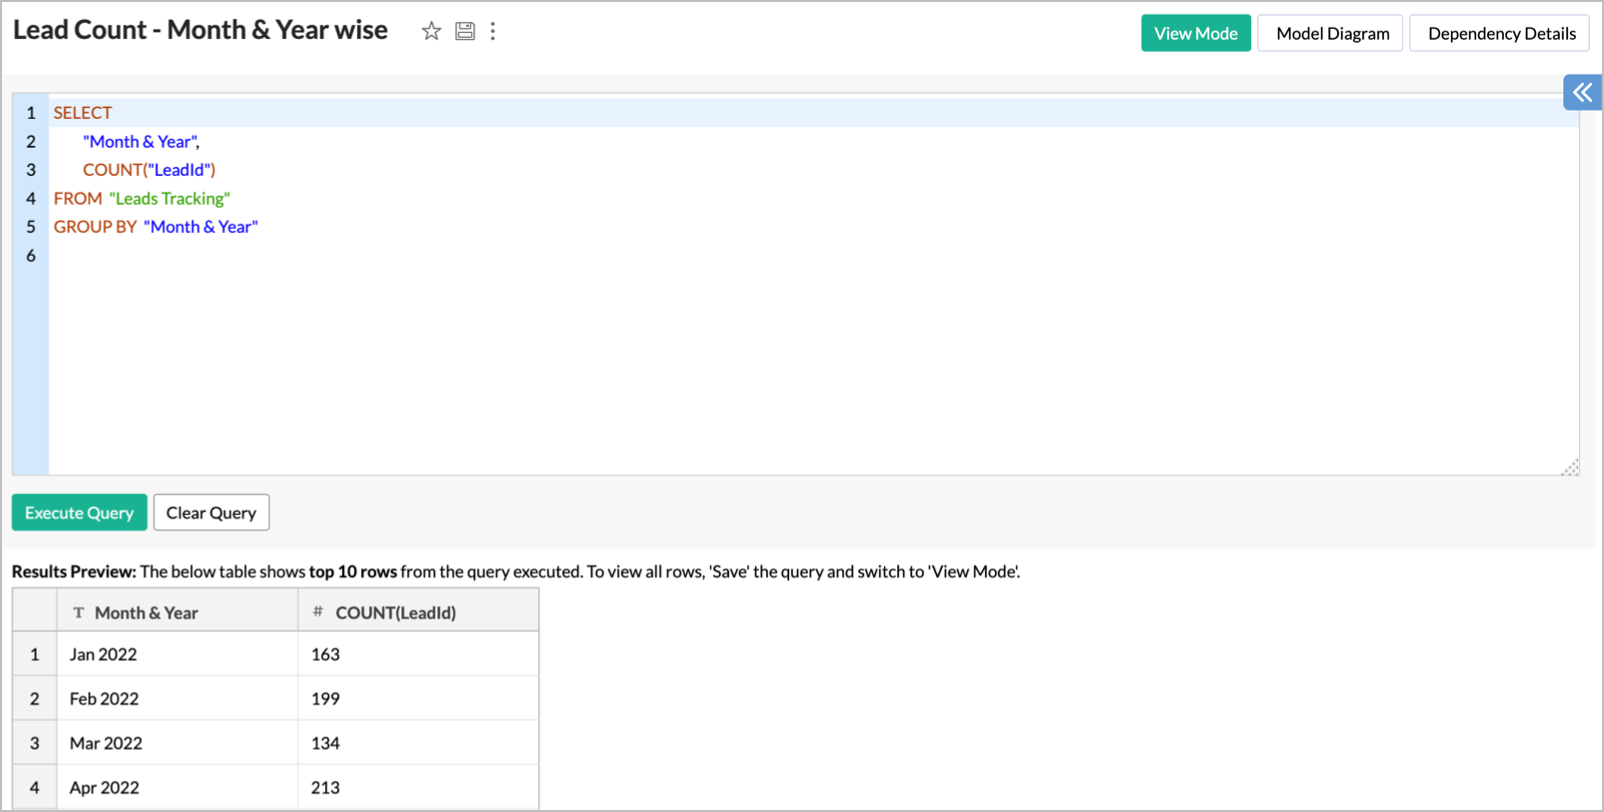
Query Table: Leads Count - Month & Year wise
SELECT "Month & Year", COUNT("LeadId") FROM "Leads Tracking" GROUP BY "Month & Year"
|
Join Query Tables
Creating Leads Conversion Cohort
- Open Pivot Designer.
- Add the columns as follows.
- Columns: Month Diff from Leads Tracking query table with Actual.
- Rows: Created Time from Leads Tracking query table with Month & Year and Count(Lead) from Month & Year wise Lead Count with Actual Dimension.
- Data: LEADID from Leads Tracking query table with Count > % of Row.
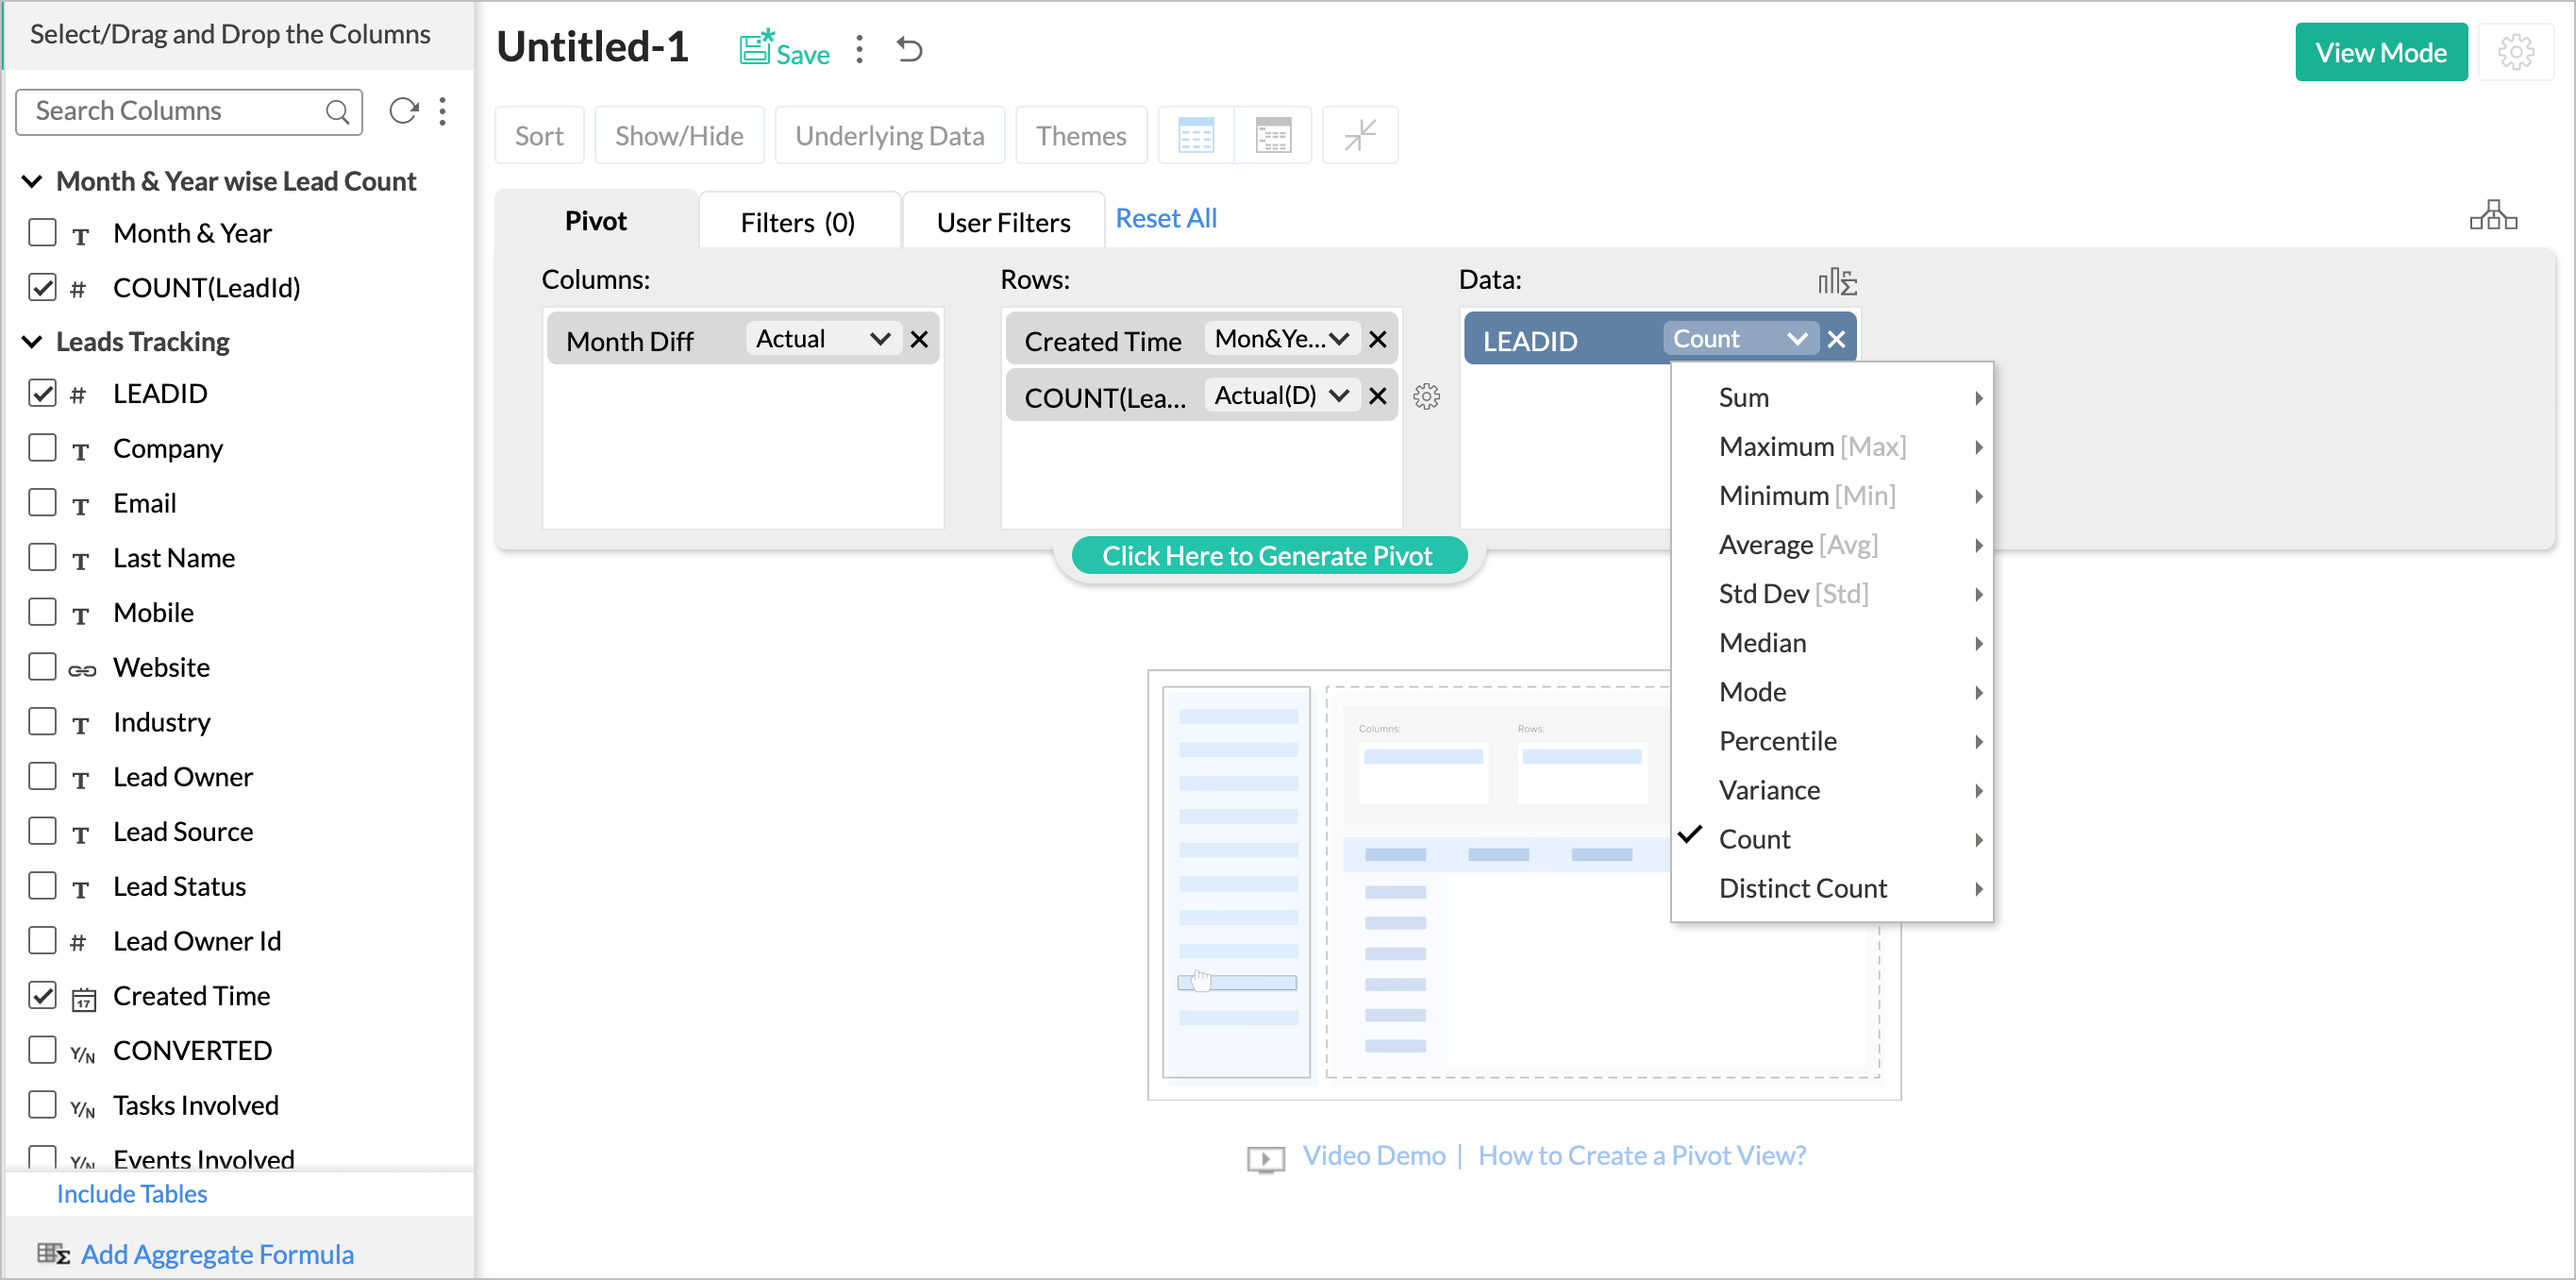
- Generate the report using Click Here to Generate Pivot.
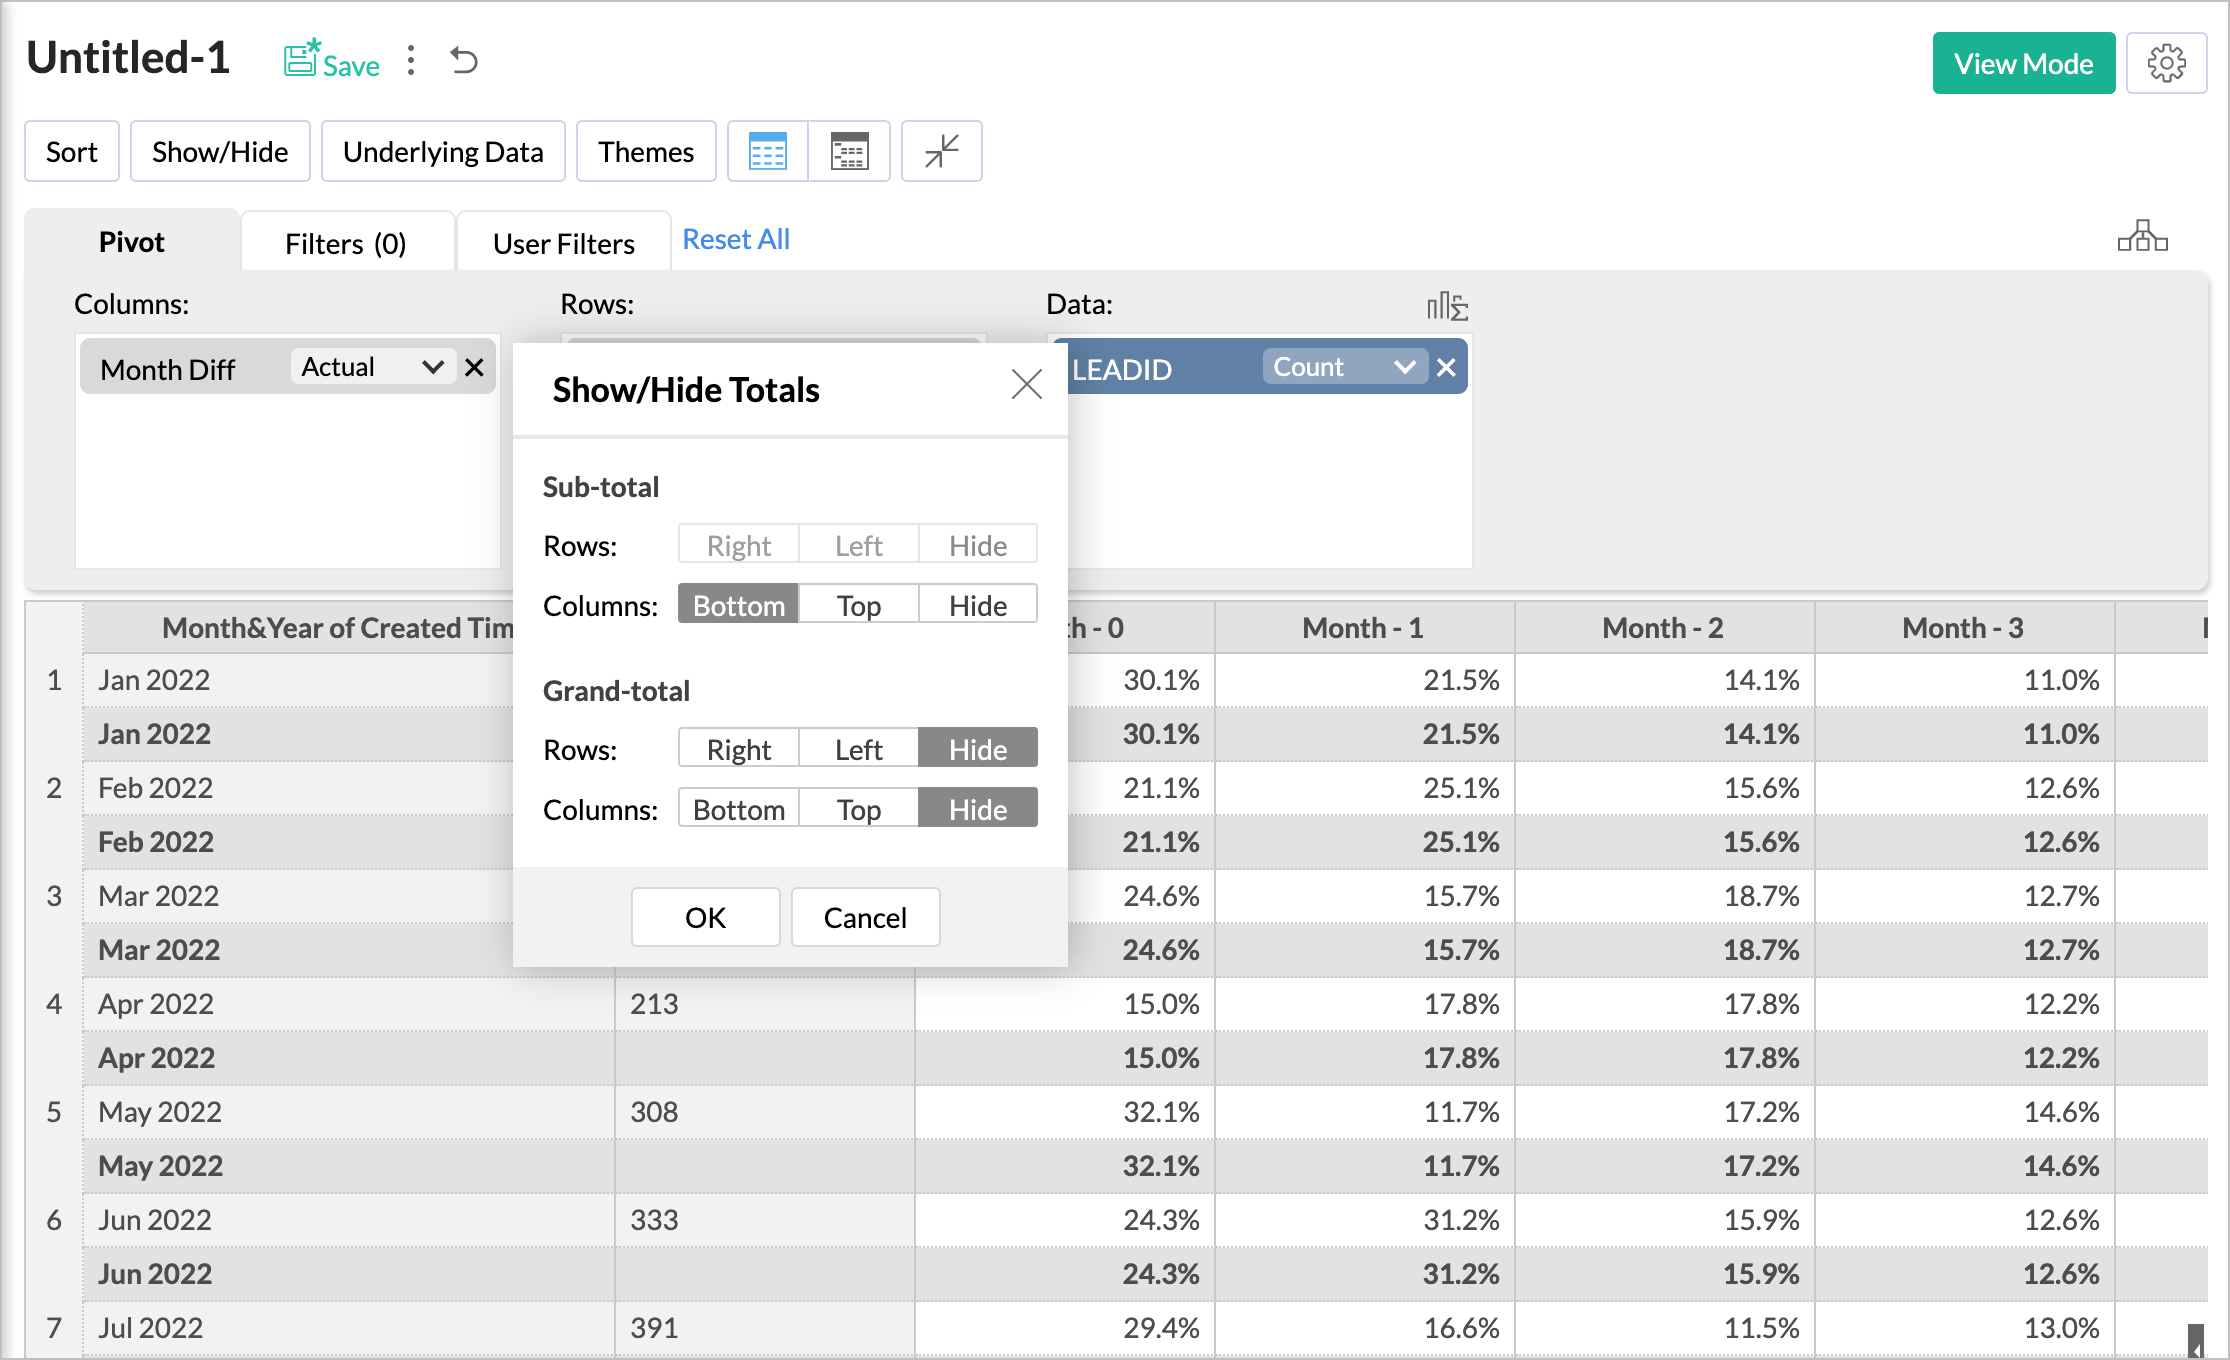
- Click Show/Hide and hide the totals.
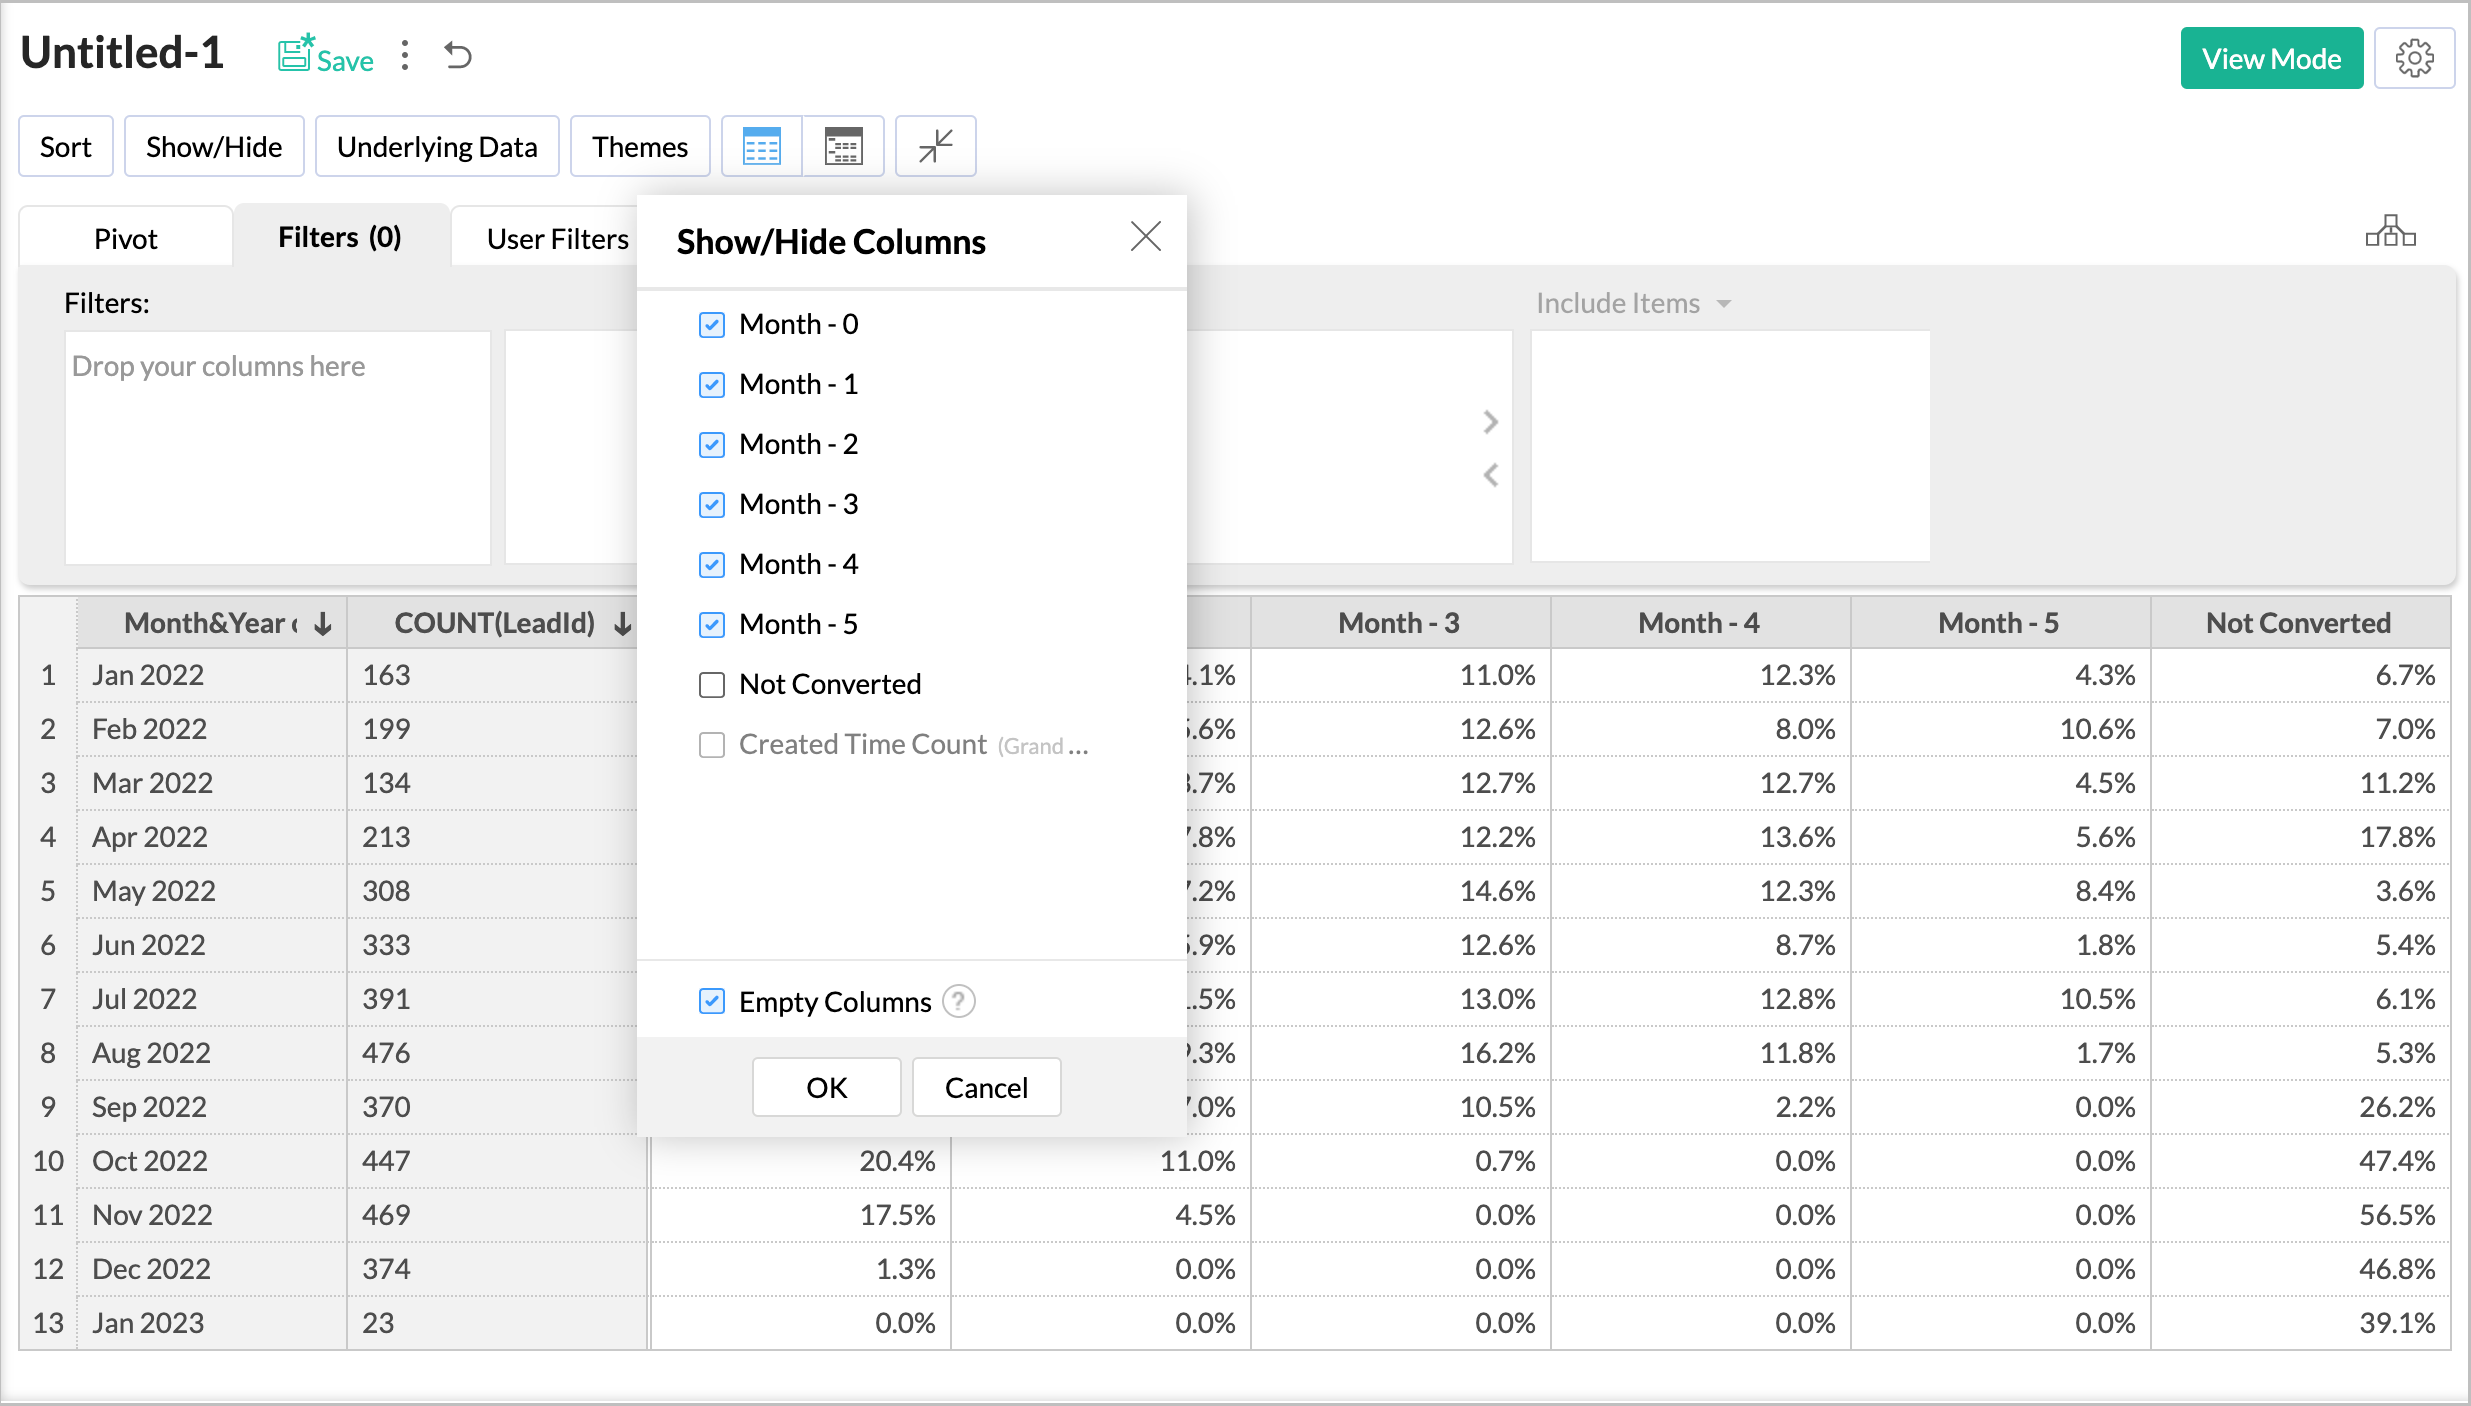
- You can choose to hide the Not Converted Column by clicking Show/Hide > Columns.
- Double-click the column header to rename it.
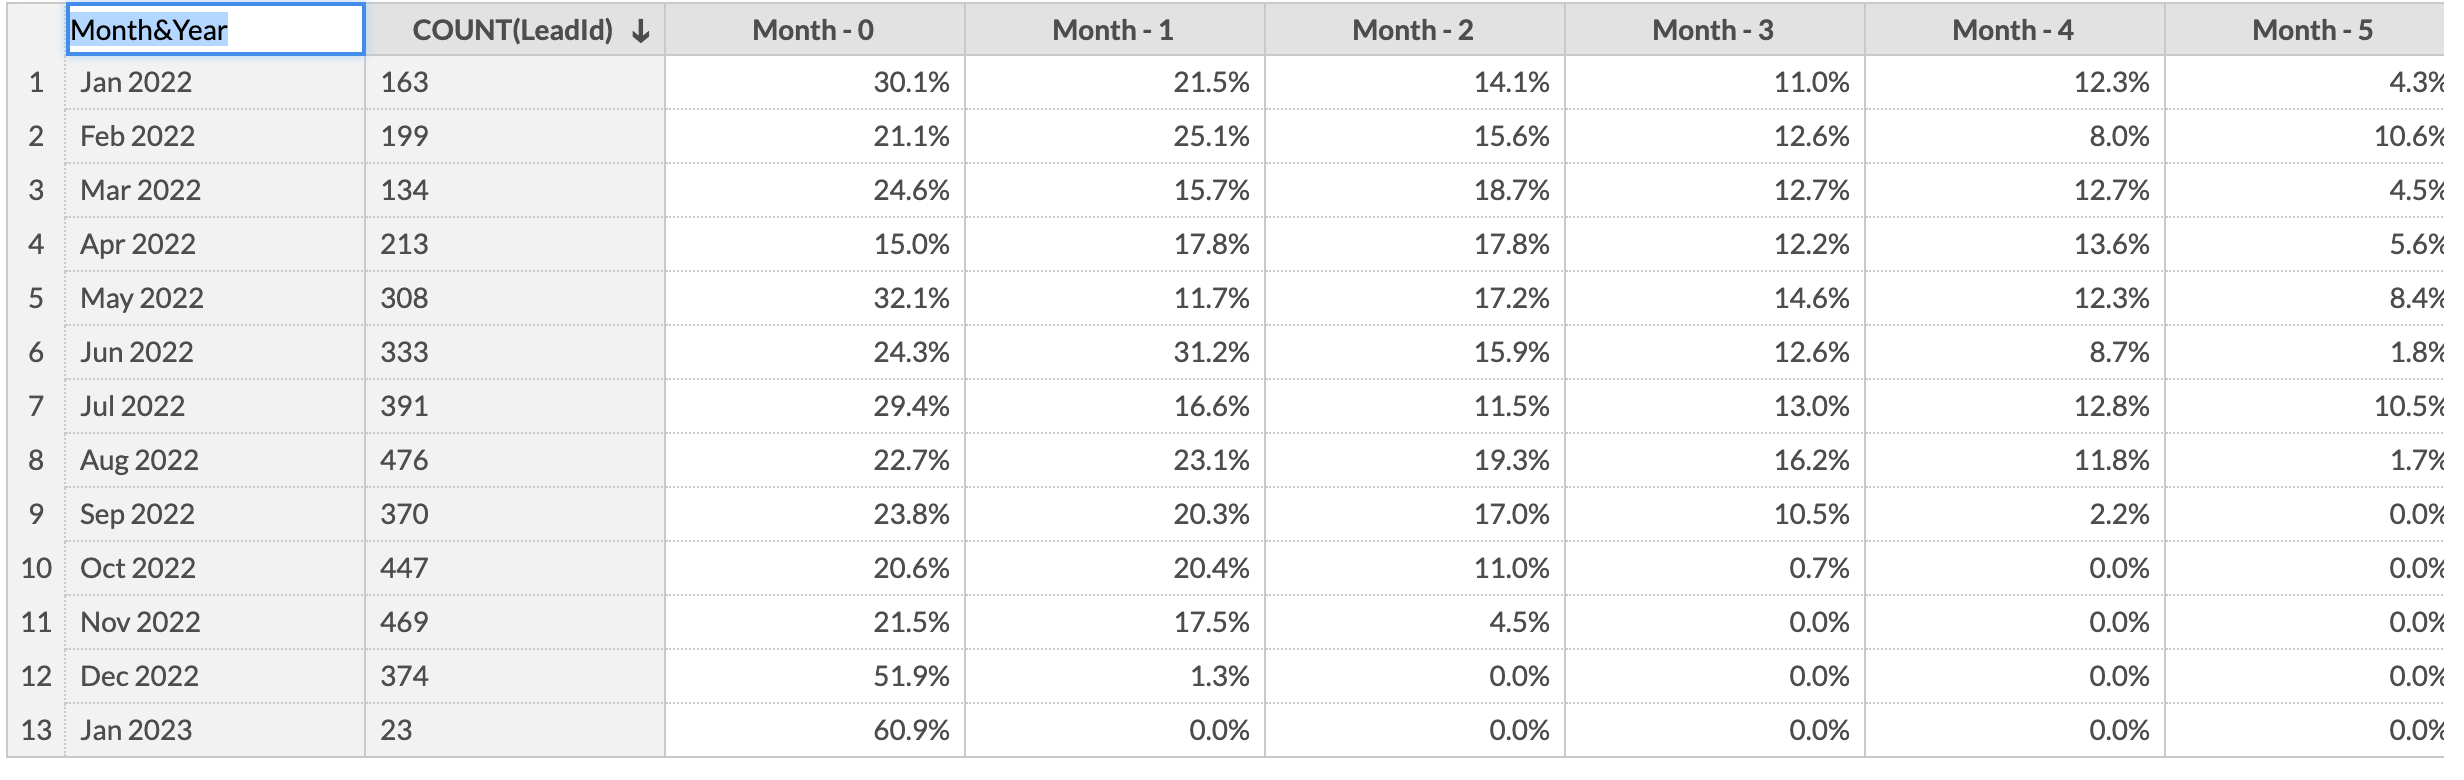
- Apply Theme.

- Apply Conditional Formatting.