Tip of the Week - Conditional Formatting Chart
Conditional formatting allows you to highlight your data series based on a pattern or a trend in your data. This makes it easy for you to identify when your data reaches certain values or when it deviates from the trend.
Zoho Analytics allows you to format chart data points with specific color based on a condition. In this week's tip, we'll see how to apply conditional formatting over your chart.
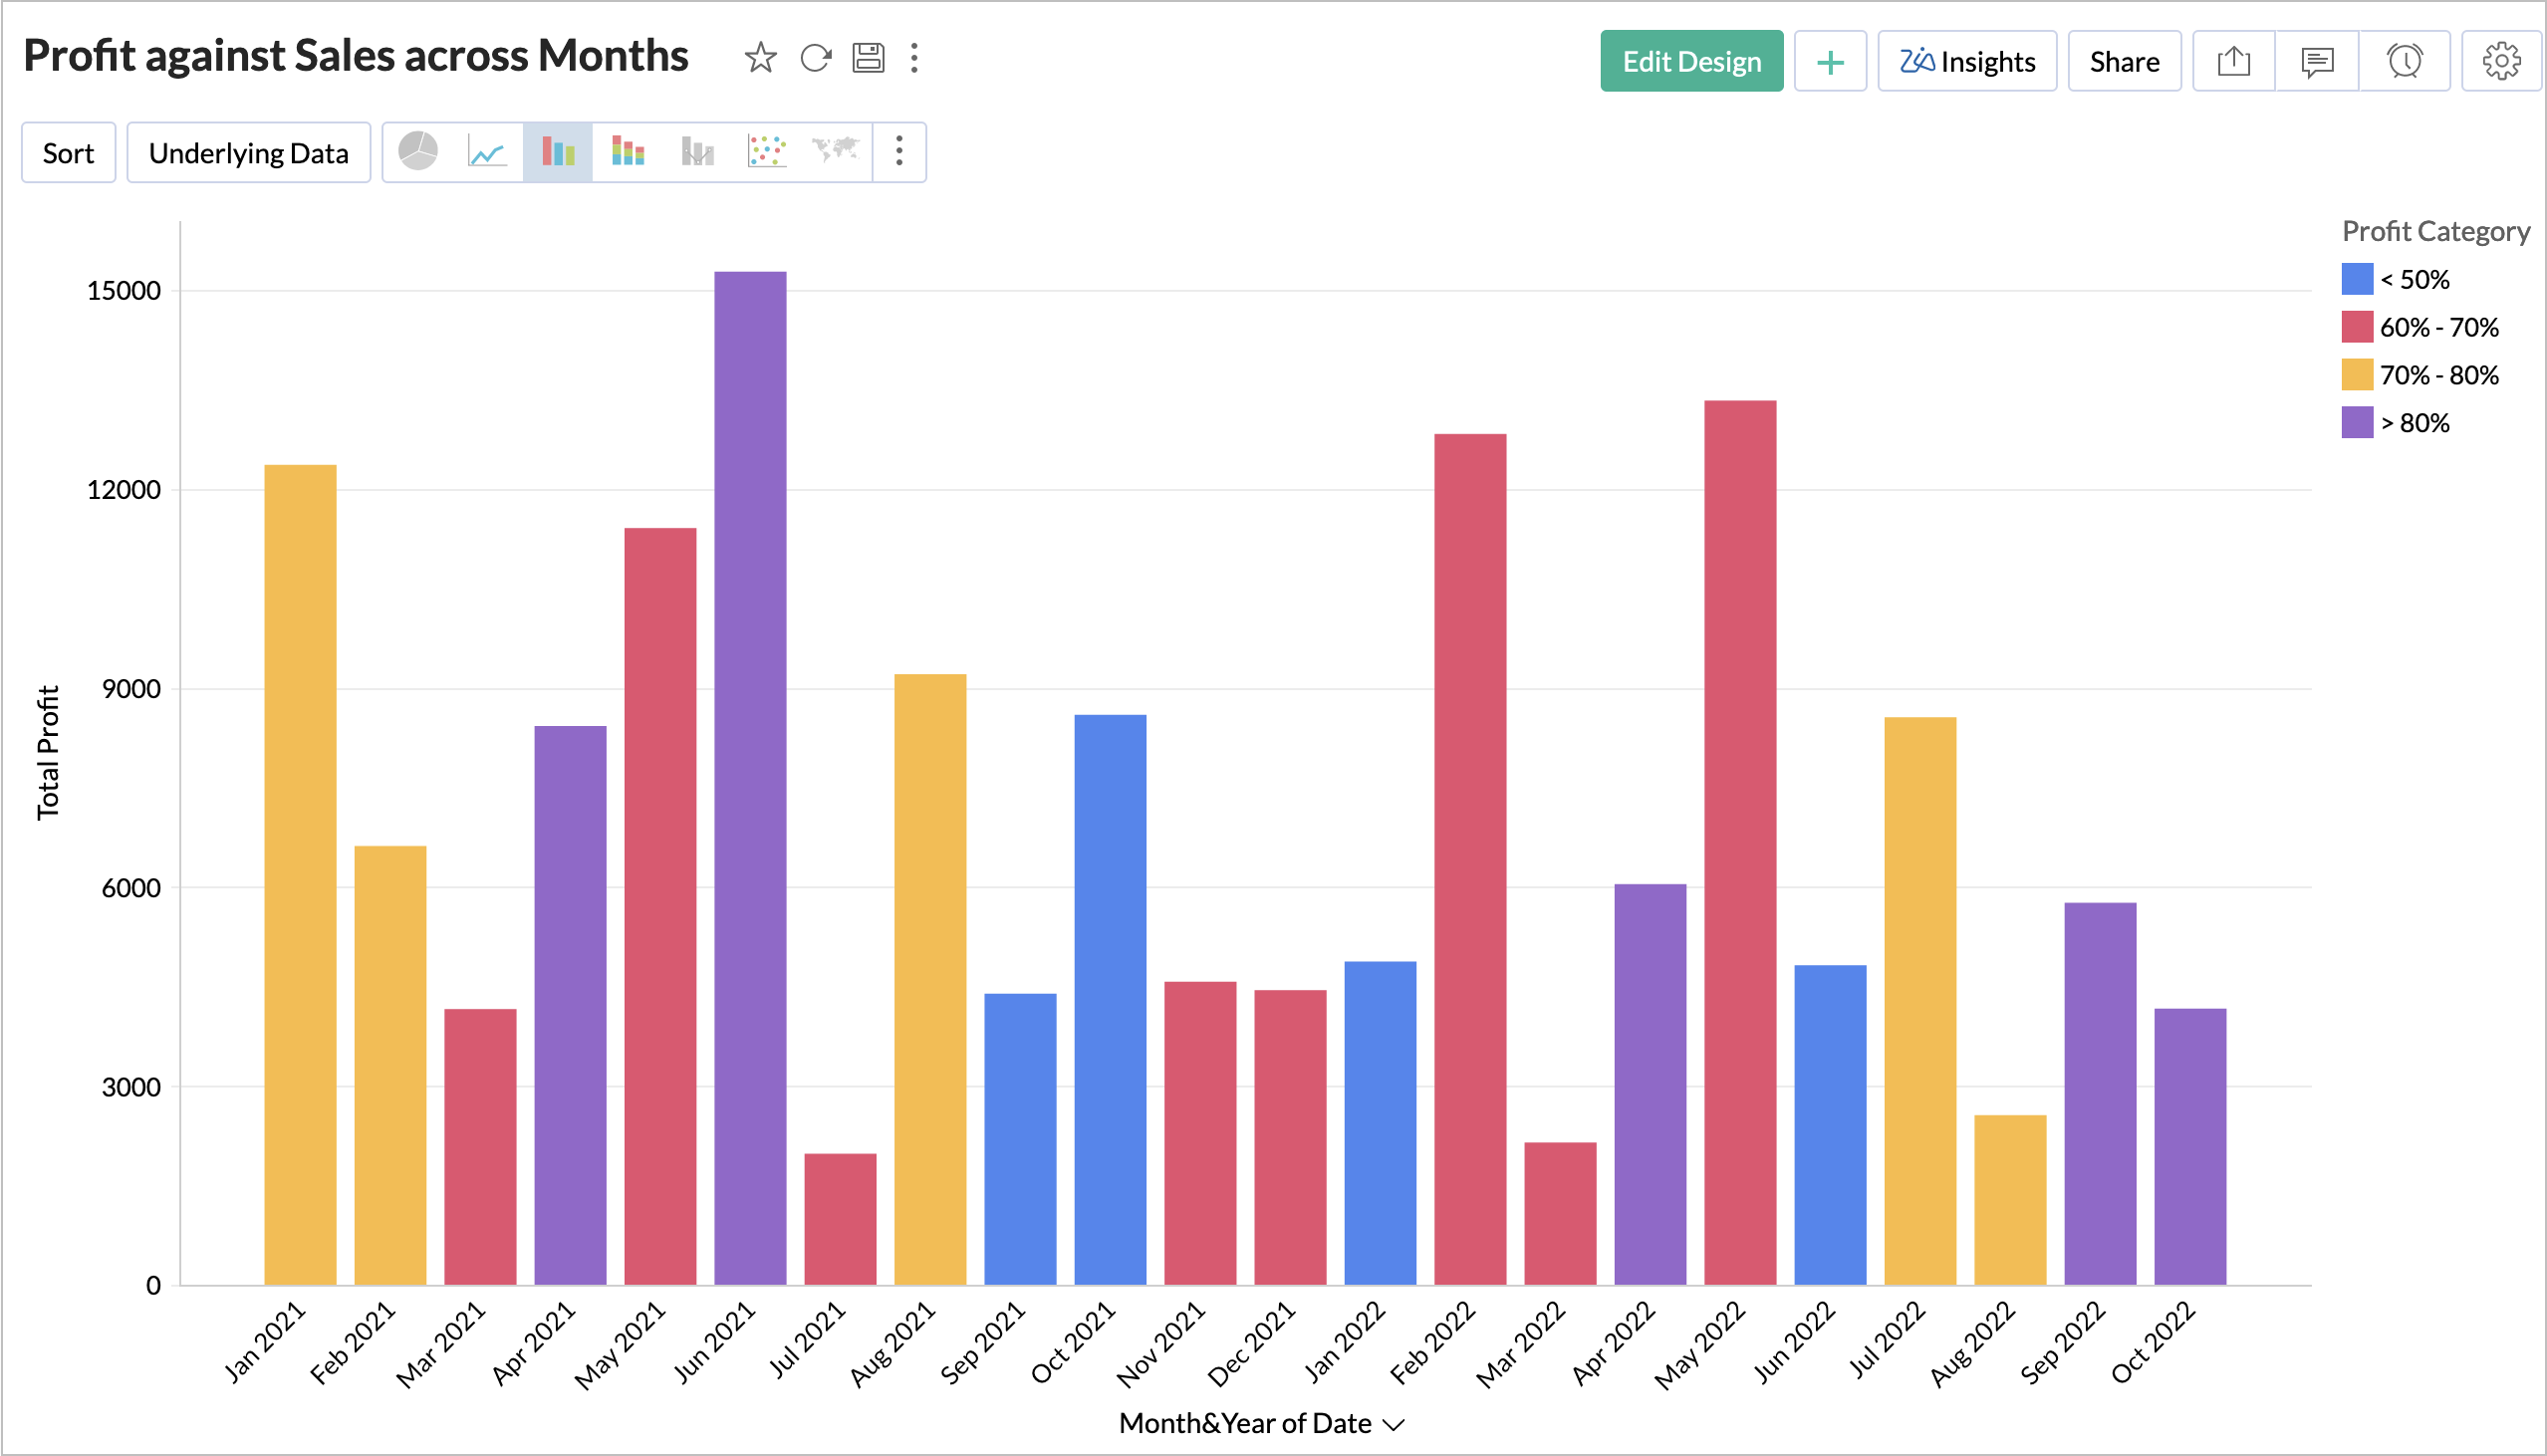
Let's see how to format the Profit across months by the profit range.
-
Open the chart in
Edit Design
mode.
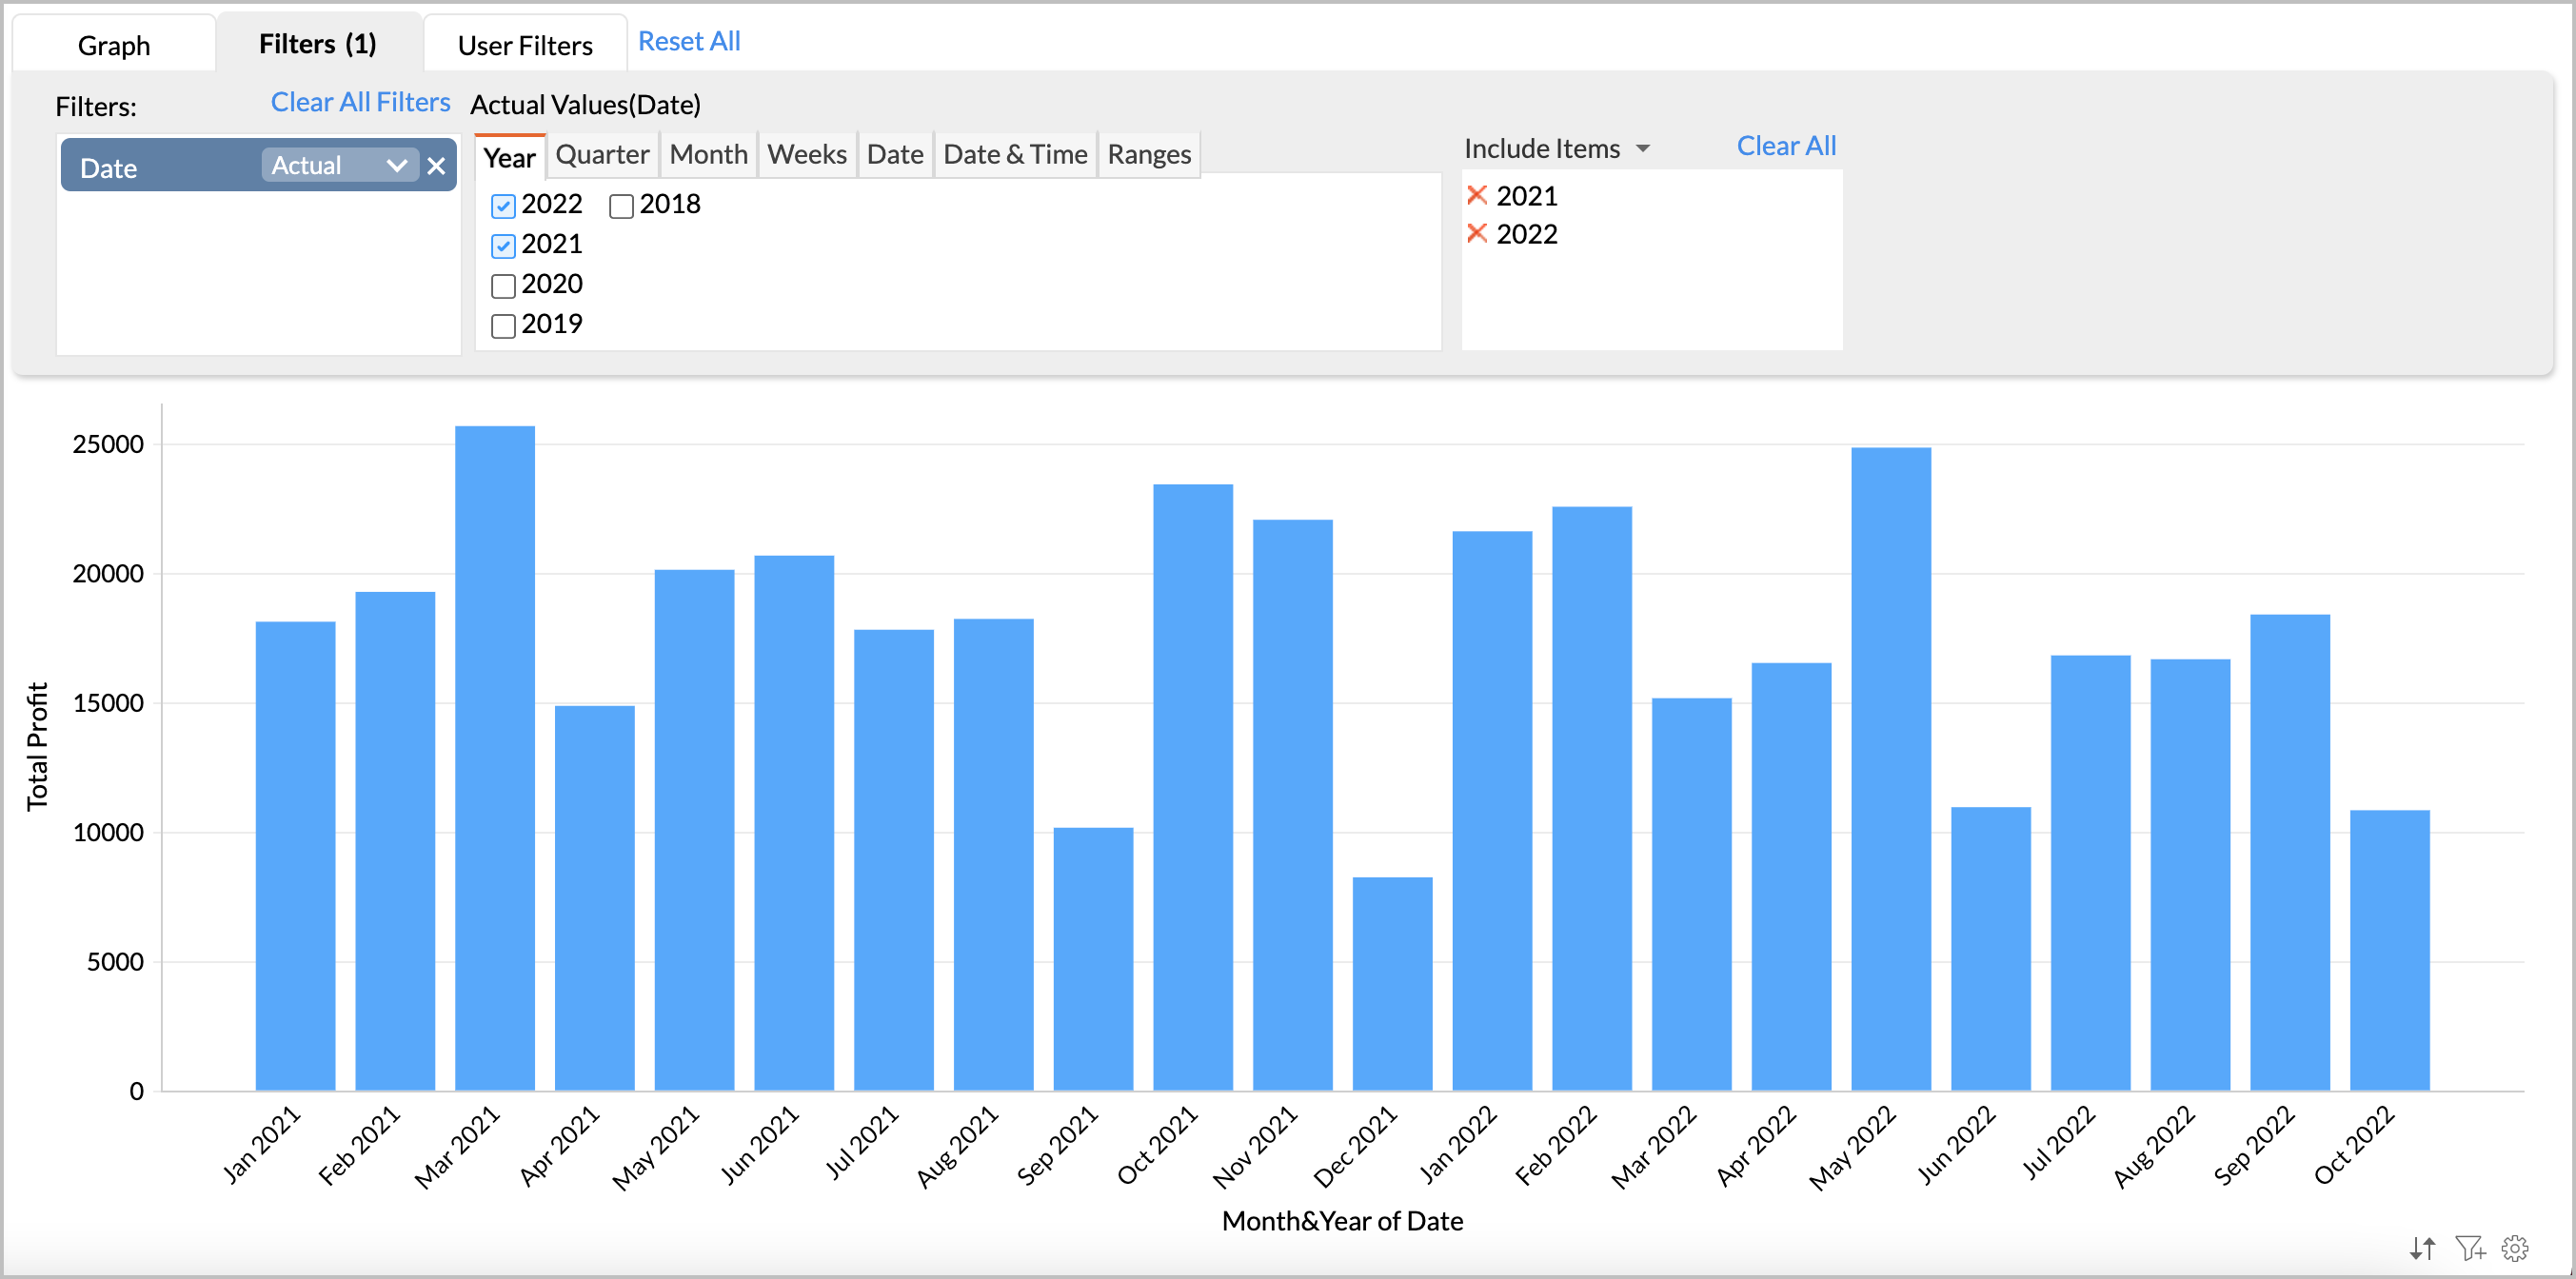
-
Add the Profit column in the Color shelf.
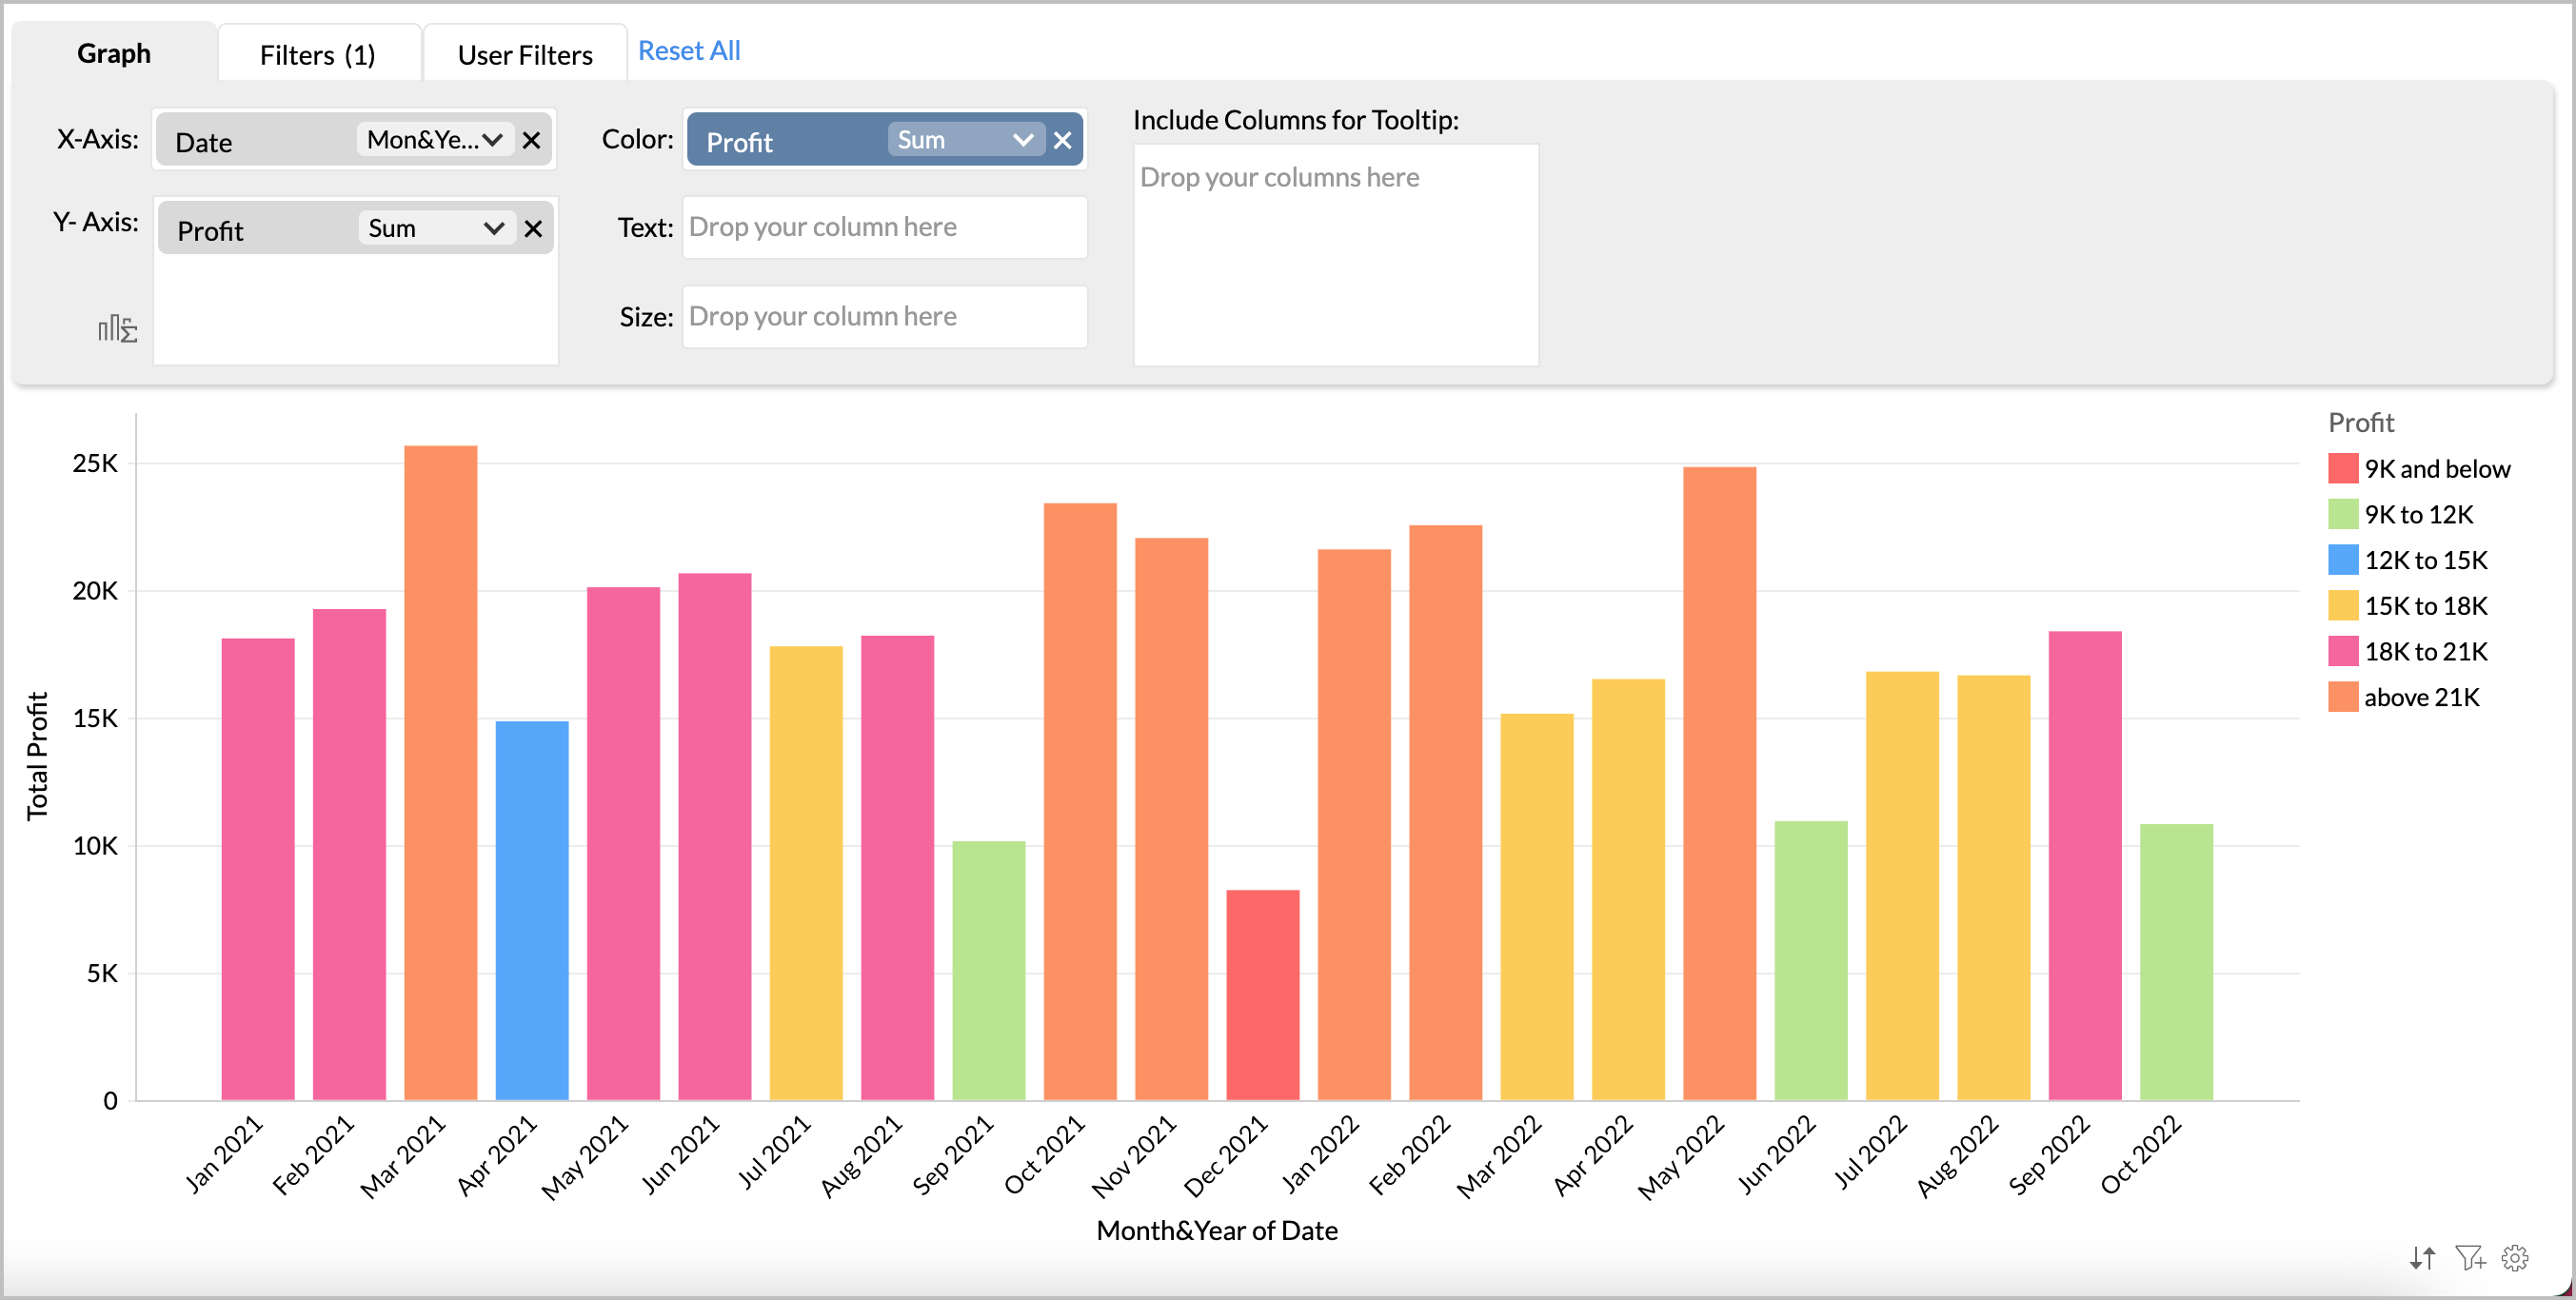
- Zoho Analytics will intelligently identify the pattern in your data to categorize your data into various buckets and apply color over them. You can change this to your own specific conditions using the Settings page.
-
Click the
Setting
icon to open the
Settings
page and navigate to the
Legend
tab.
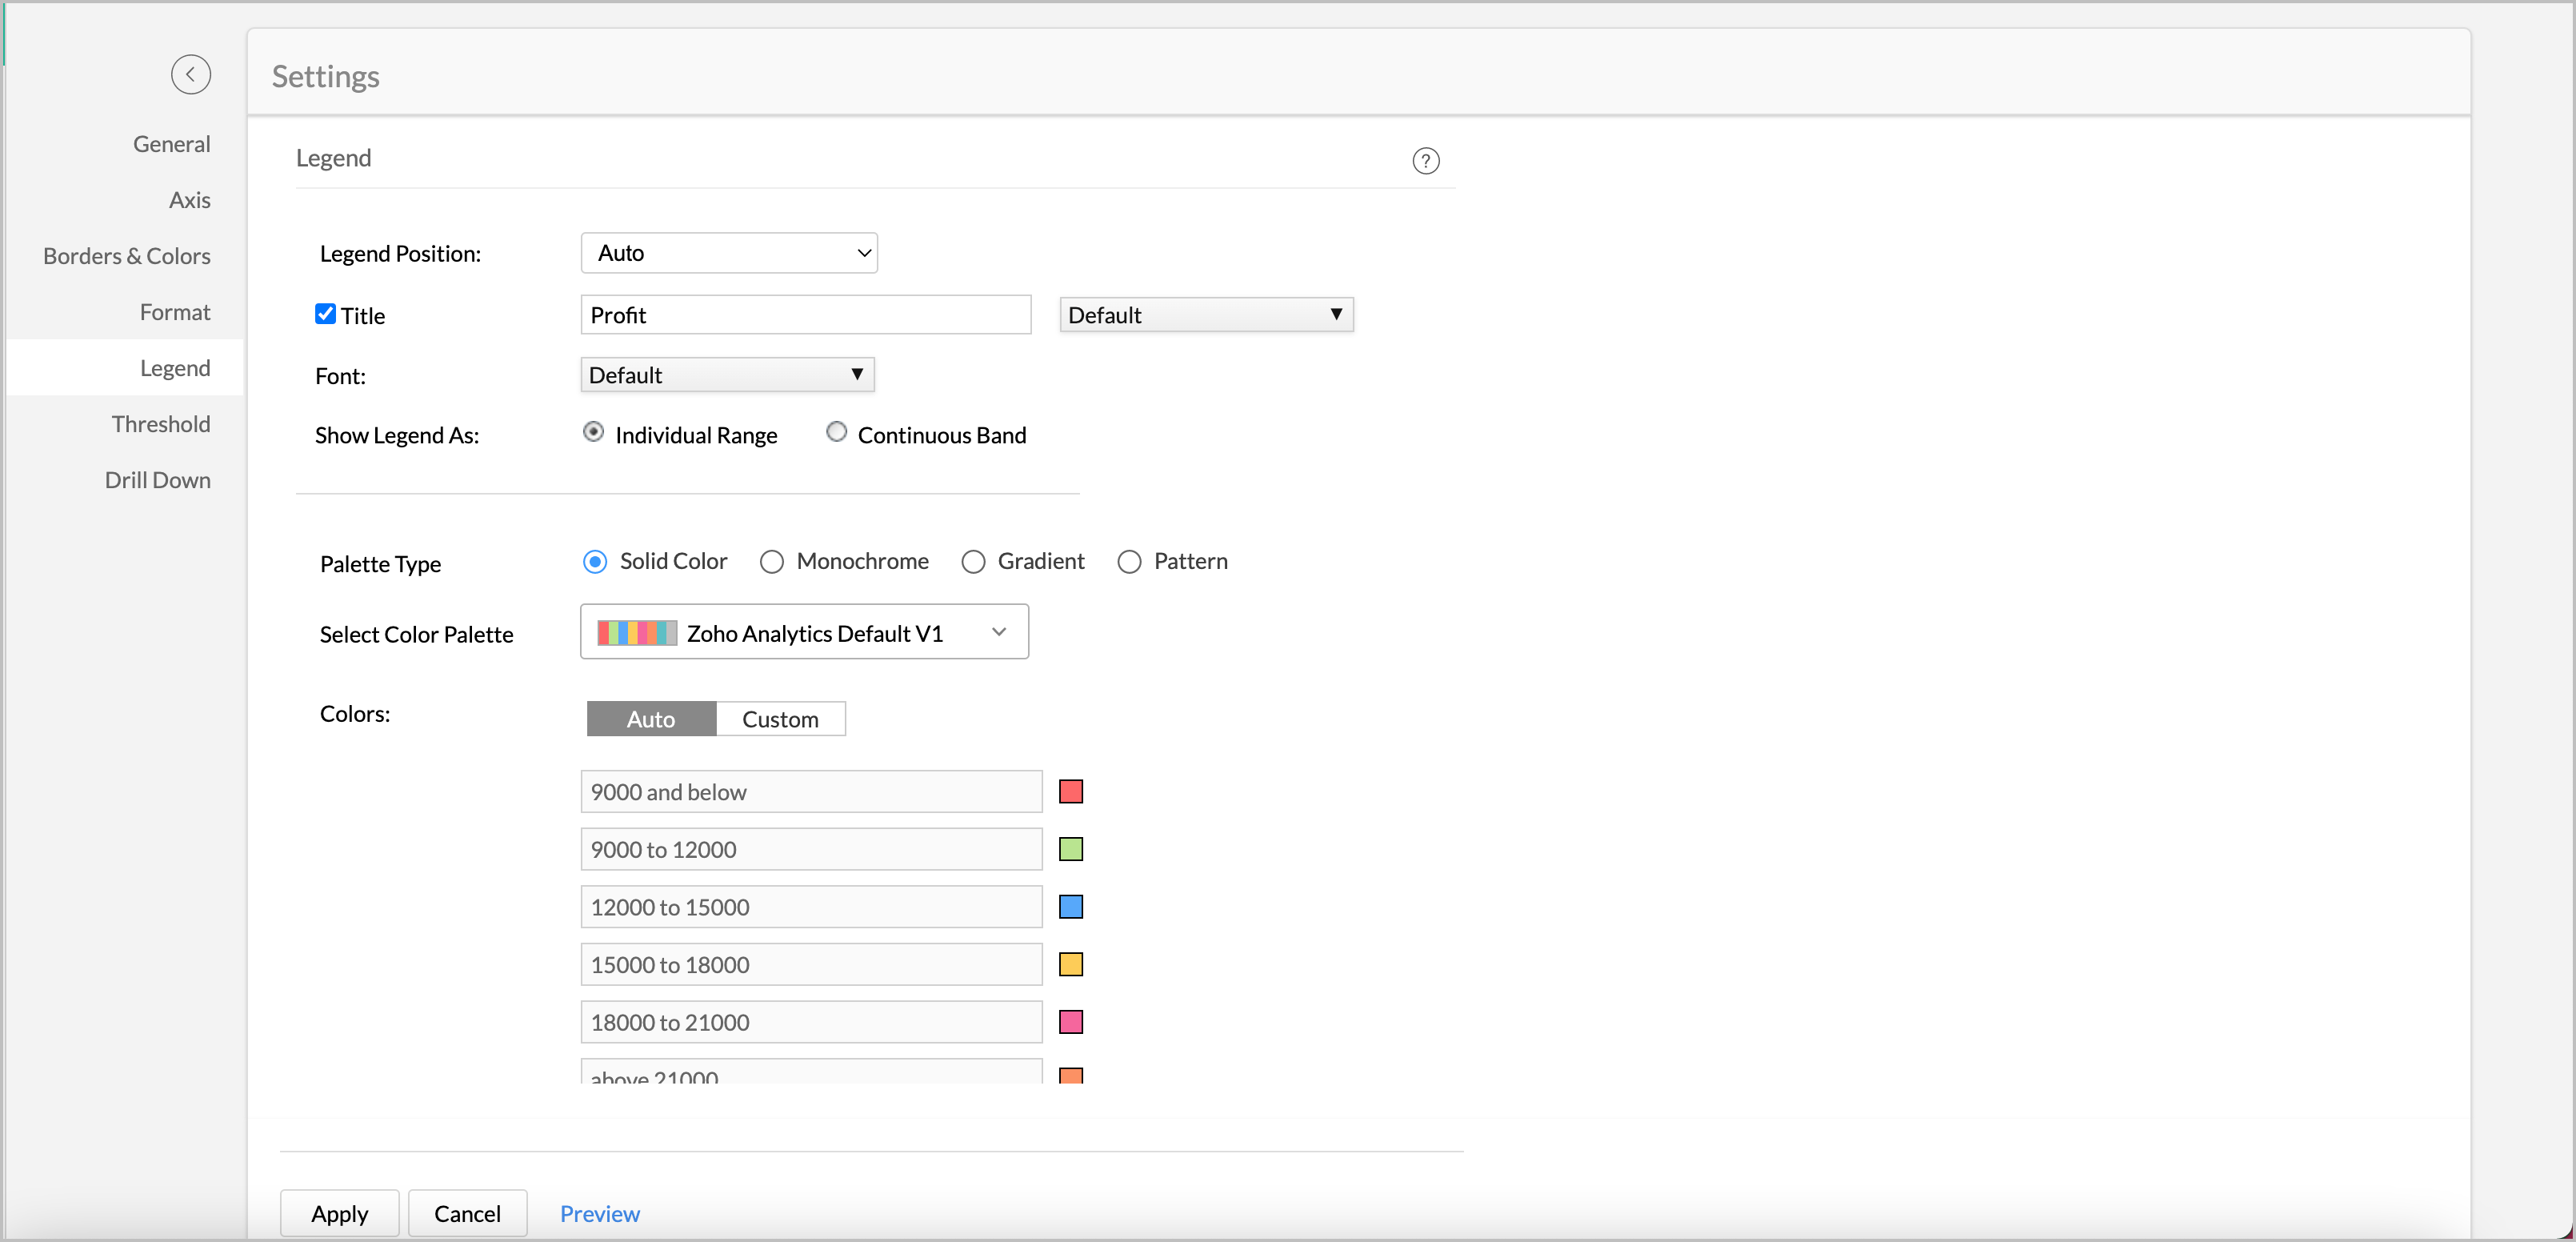
-
In the
Color
section, click
Custom
.
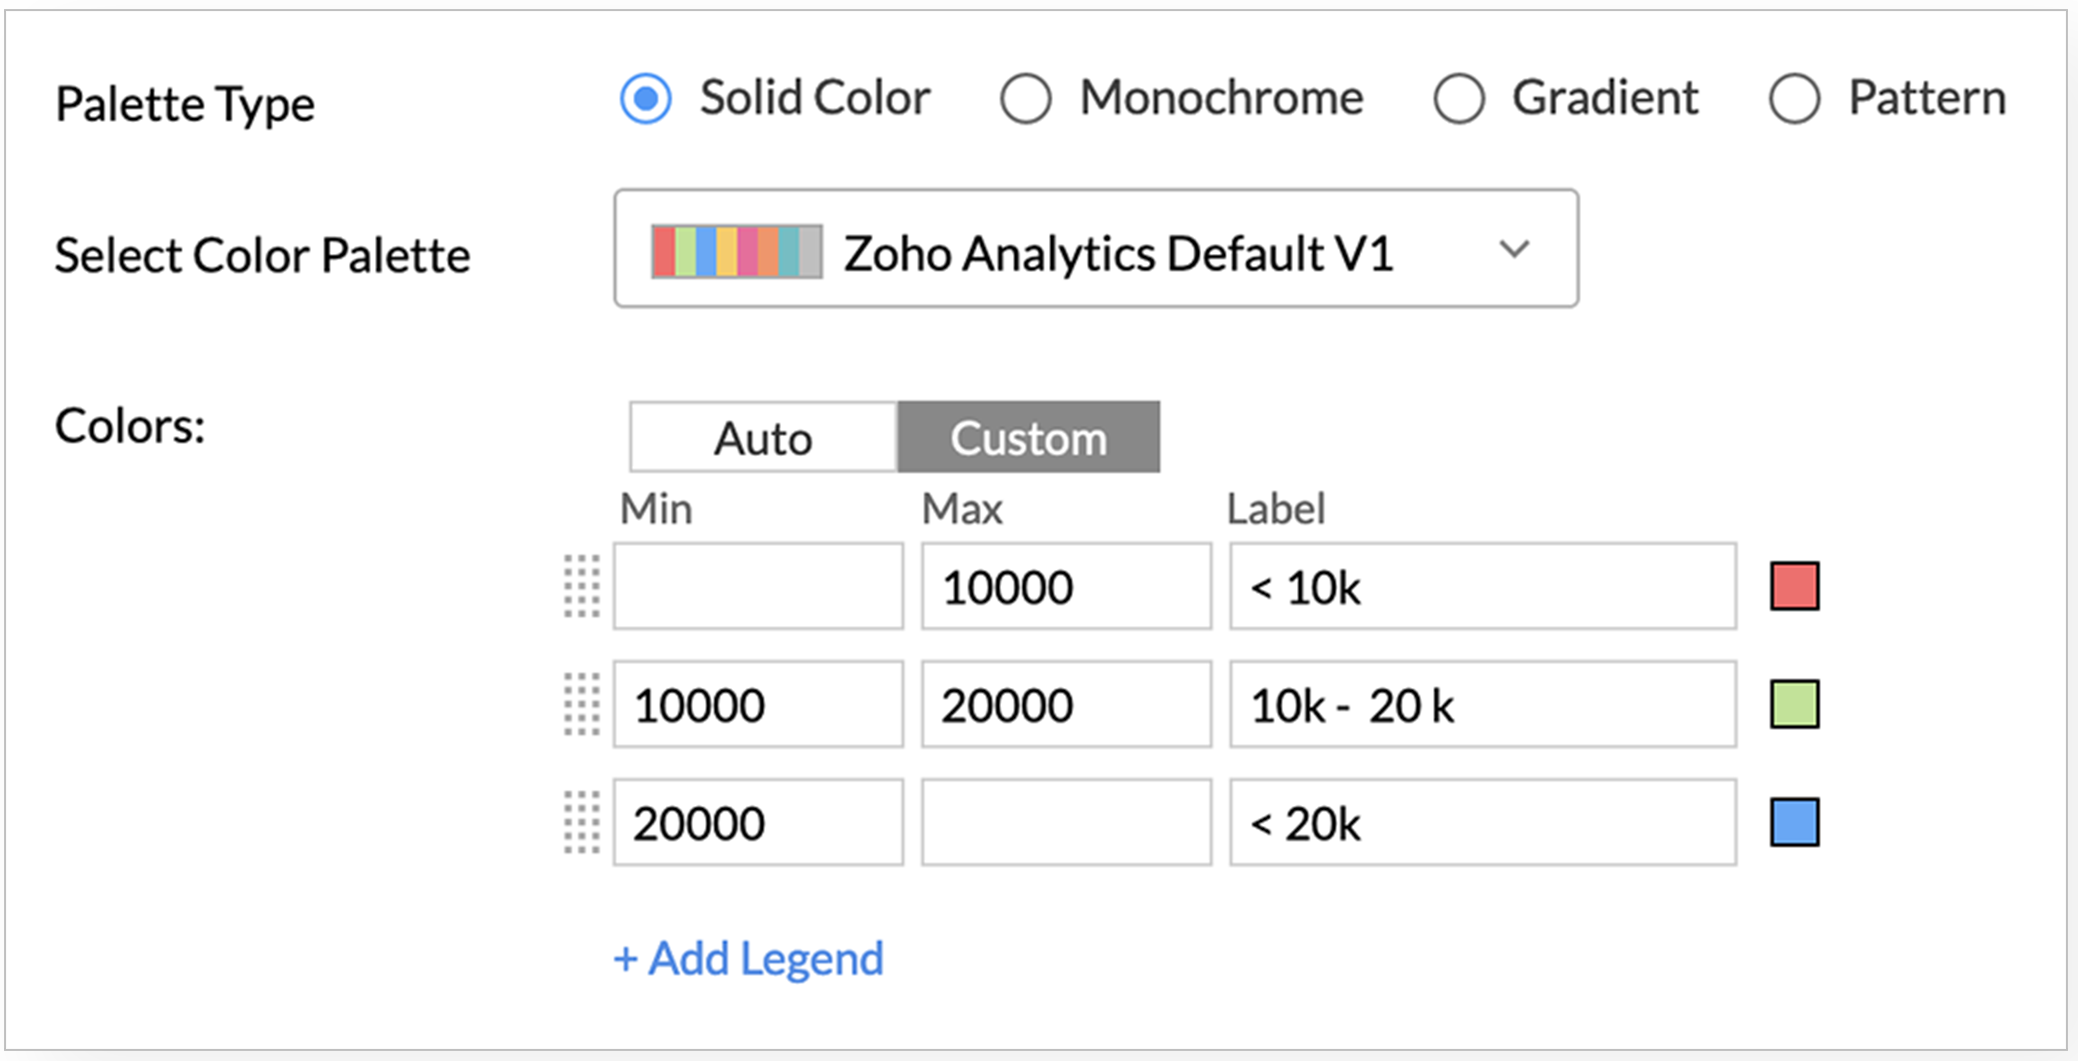
- Specify the range to format in the Min and the Max field.
-
In the Label field, specify required name for your legends.
-
Click the
Color
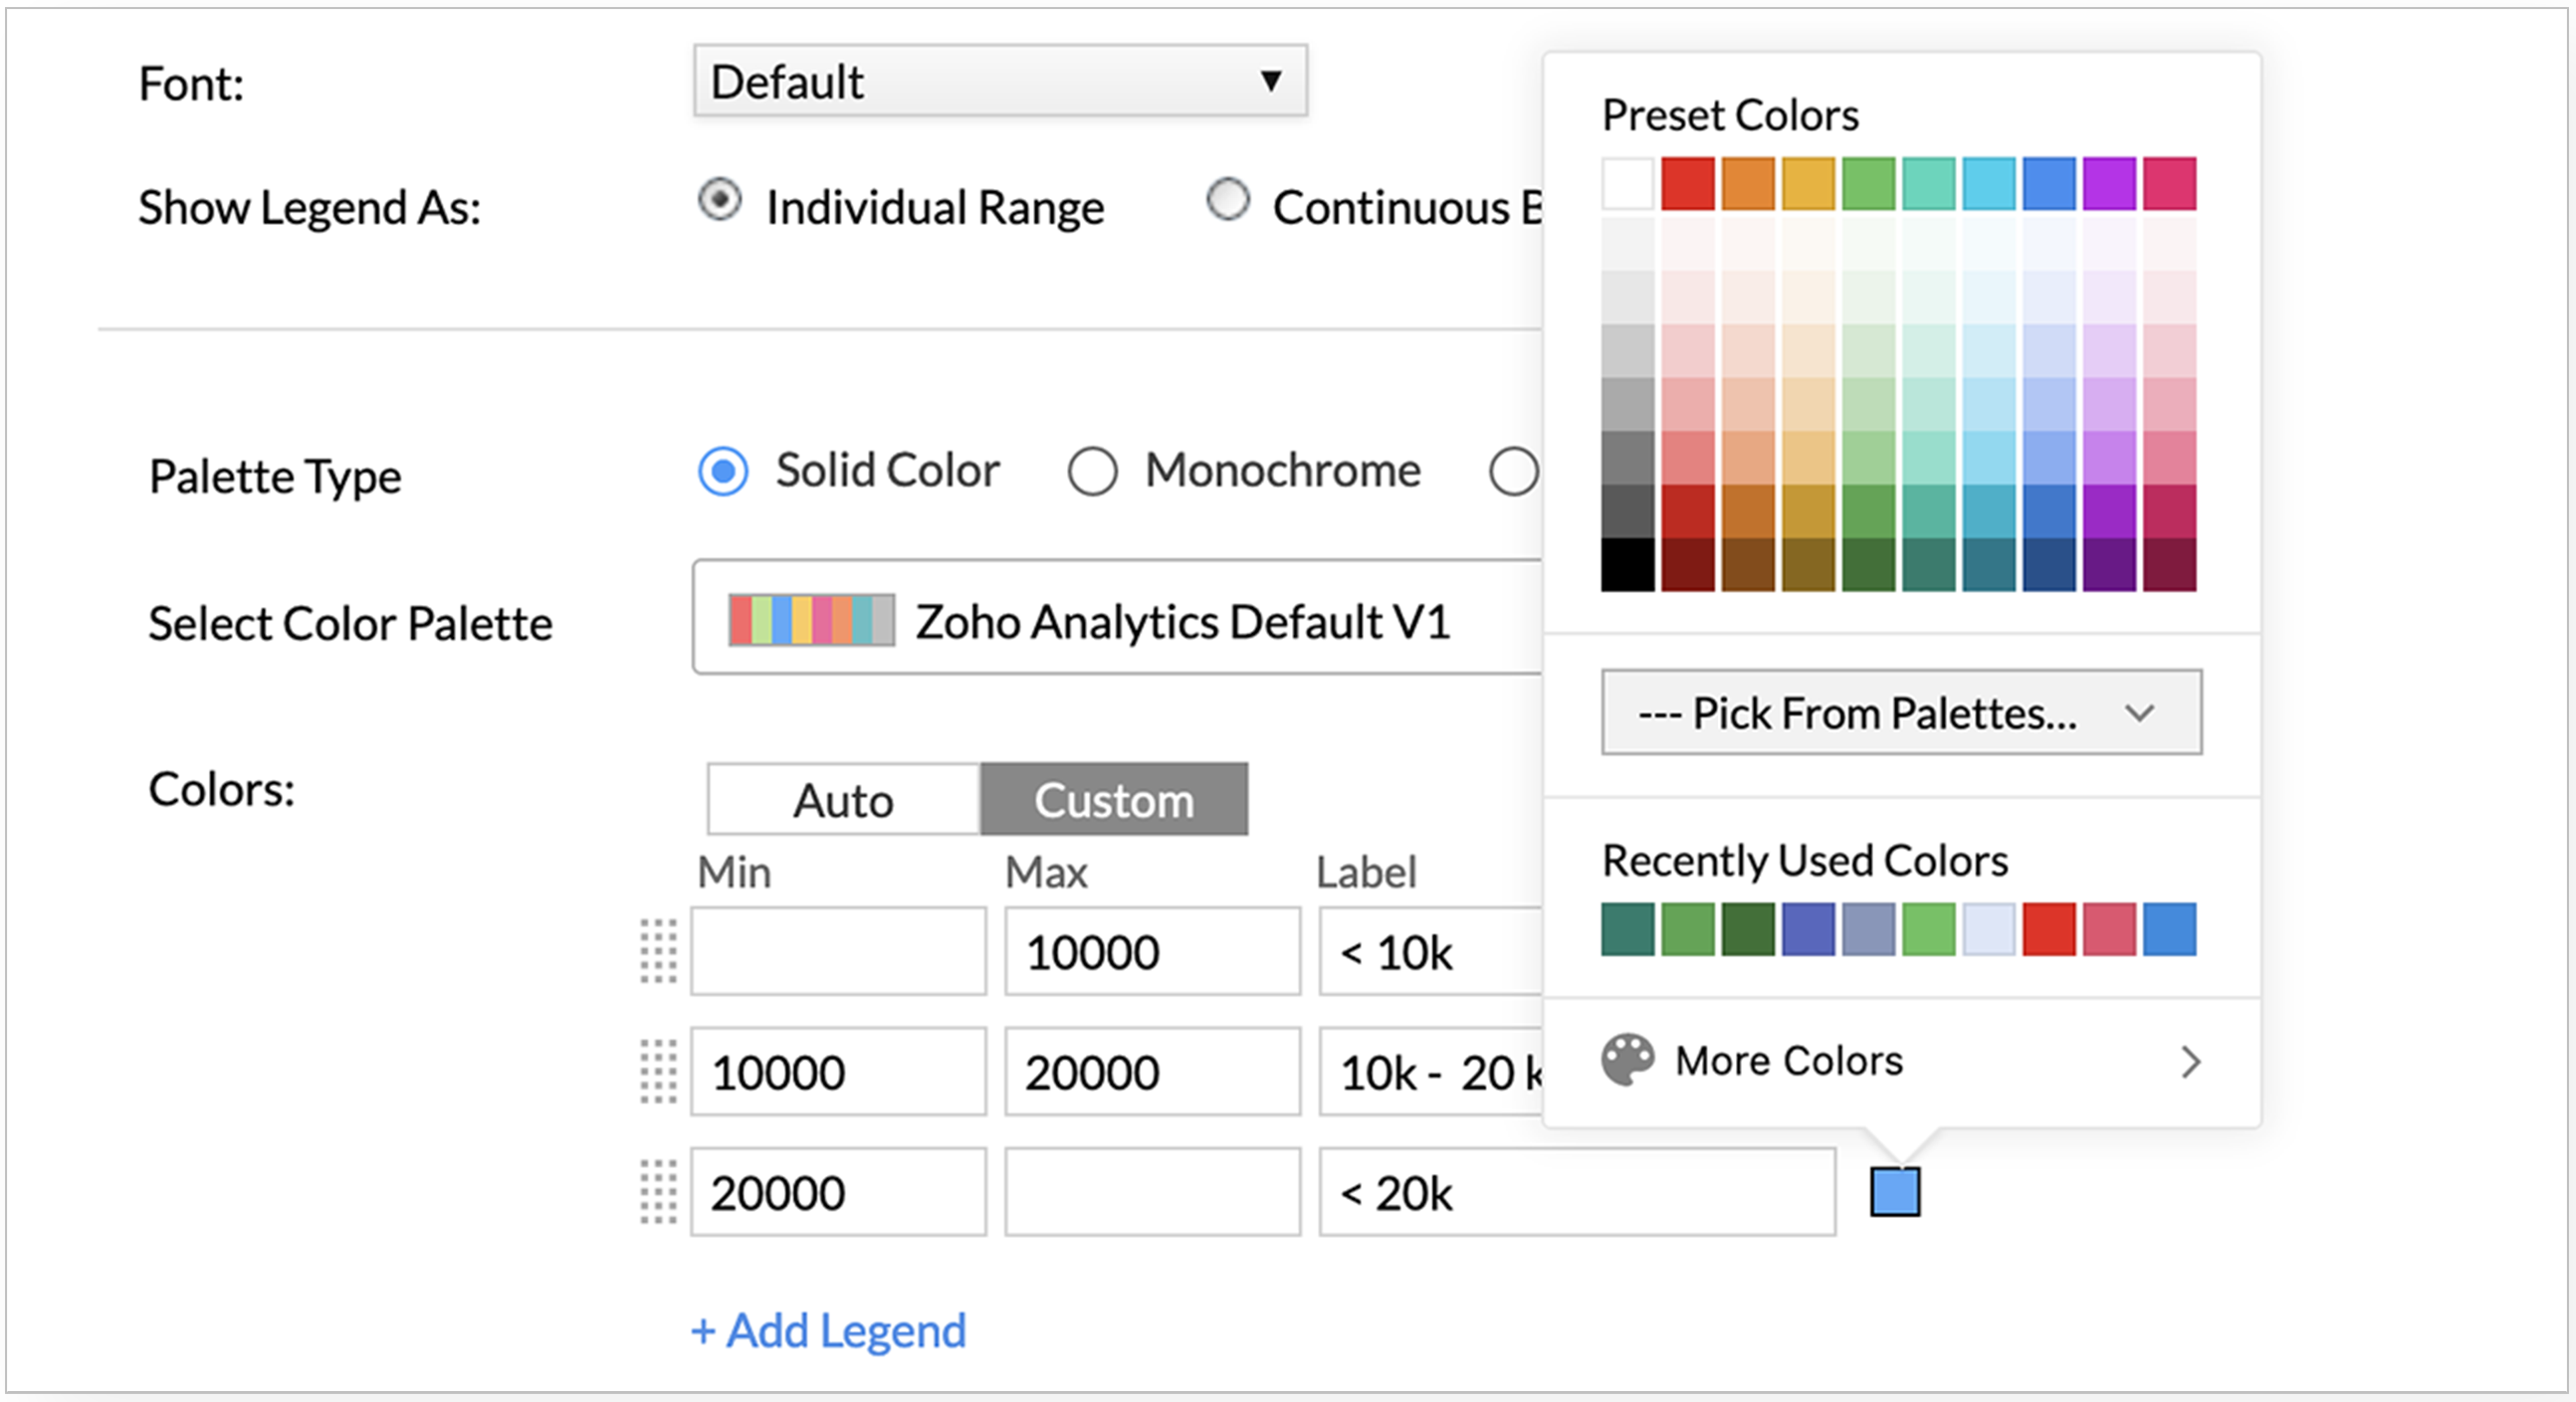
tile to change color.
-
Click
Apply
. The chart will be formatted based on the conditions you have specified.
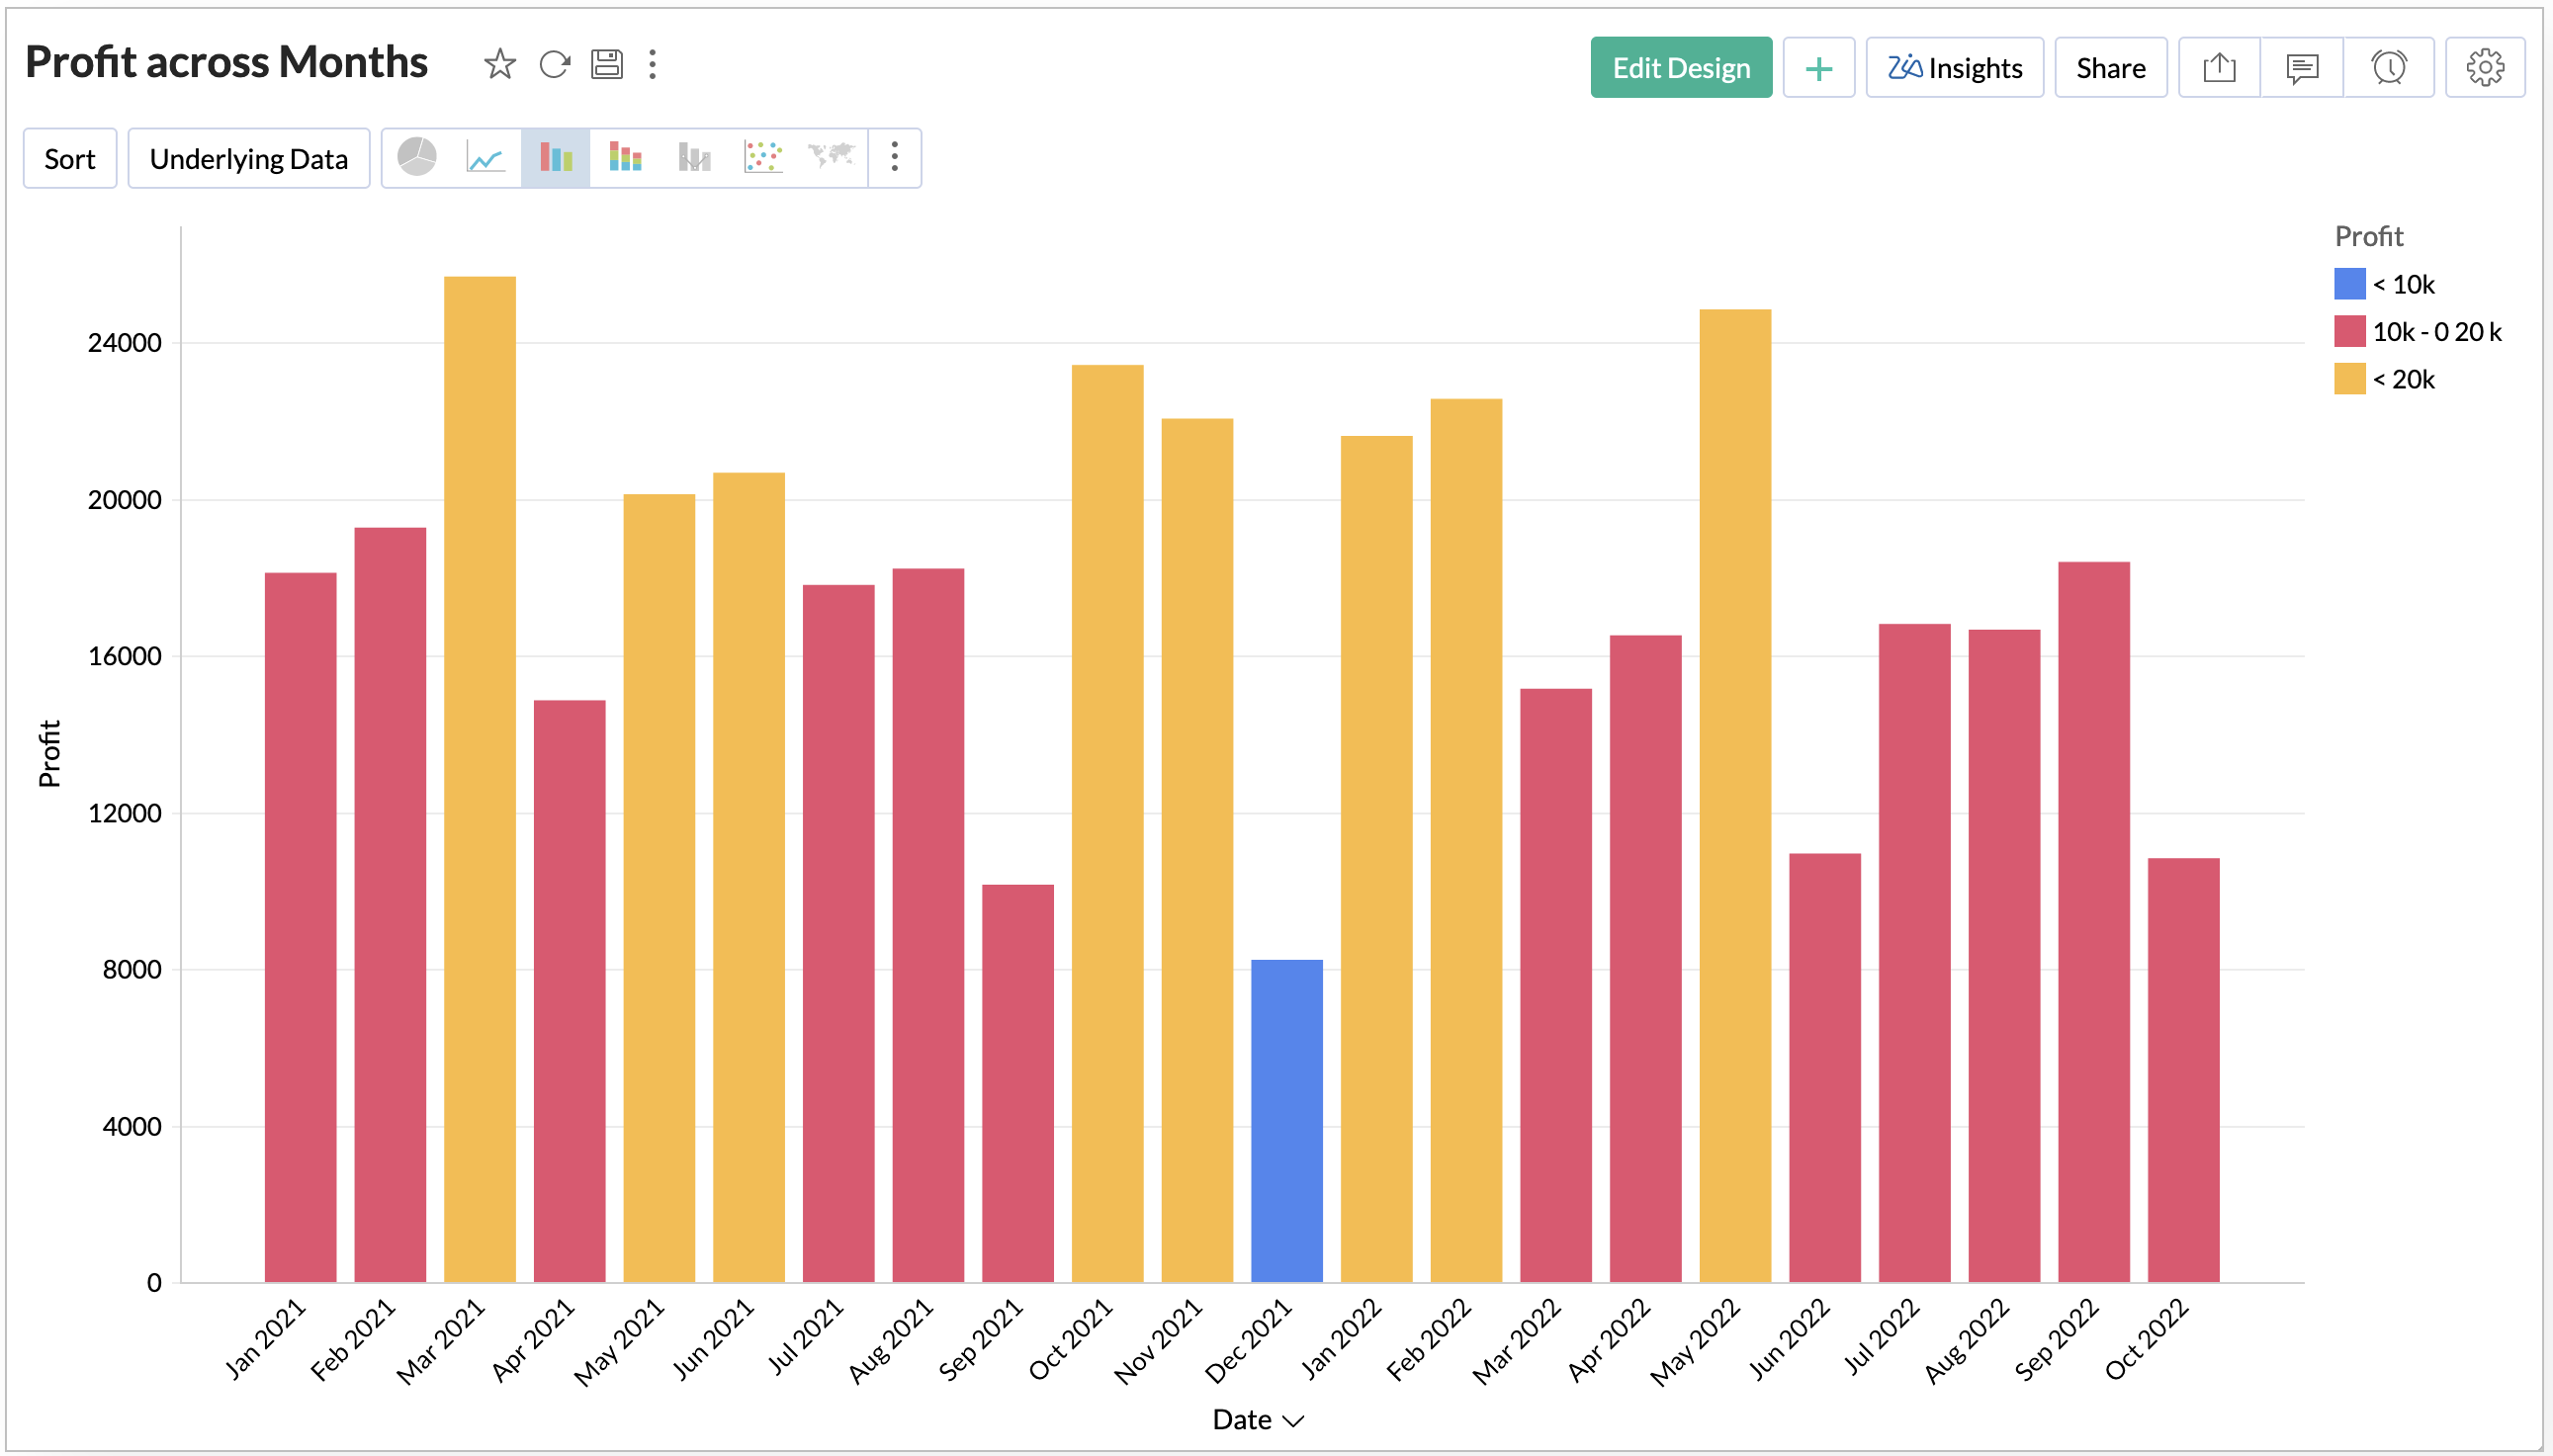
Now we have applied formatting based on a simple condition. Zoho Analytics allows you to format the chart based on advanced conditions using the Formulas .
Let's see how to format the same chart by the Profit Percentage based on your sales.
-
Create a formula to calculate the Profit Percentage using the following format.
sum( "Sales"."Profit" )/sum( "Sales"."Sales" )
- Now categorize the profit into groups based on profit percentage. The following formula groups profit into below four groups.
- below 50%
- 50% - 60%
-
60% - 70%
-
Above 70%
if( "Sales"."Profit Percentage" < 0.5,1 , if( "Sales"."Profit Percentage" < 0.6,2, if( "Sales"."Profit Percentage" < 0.7,3,4 )))
-
Now add the
Profit Category
formula in the Color shelf of chart designer.
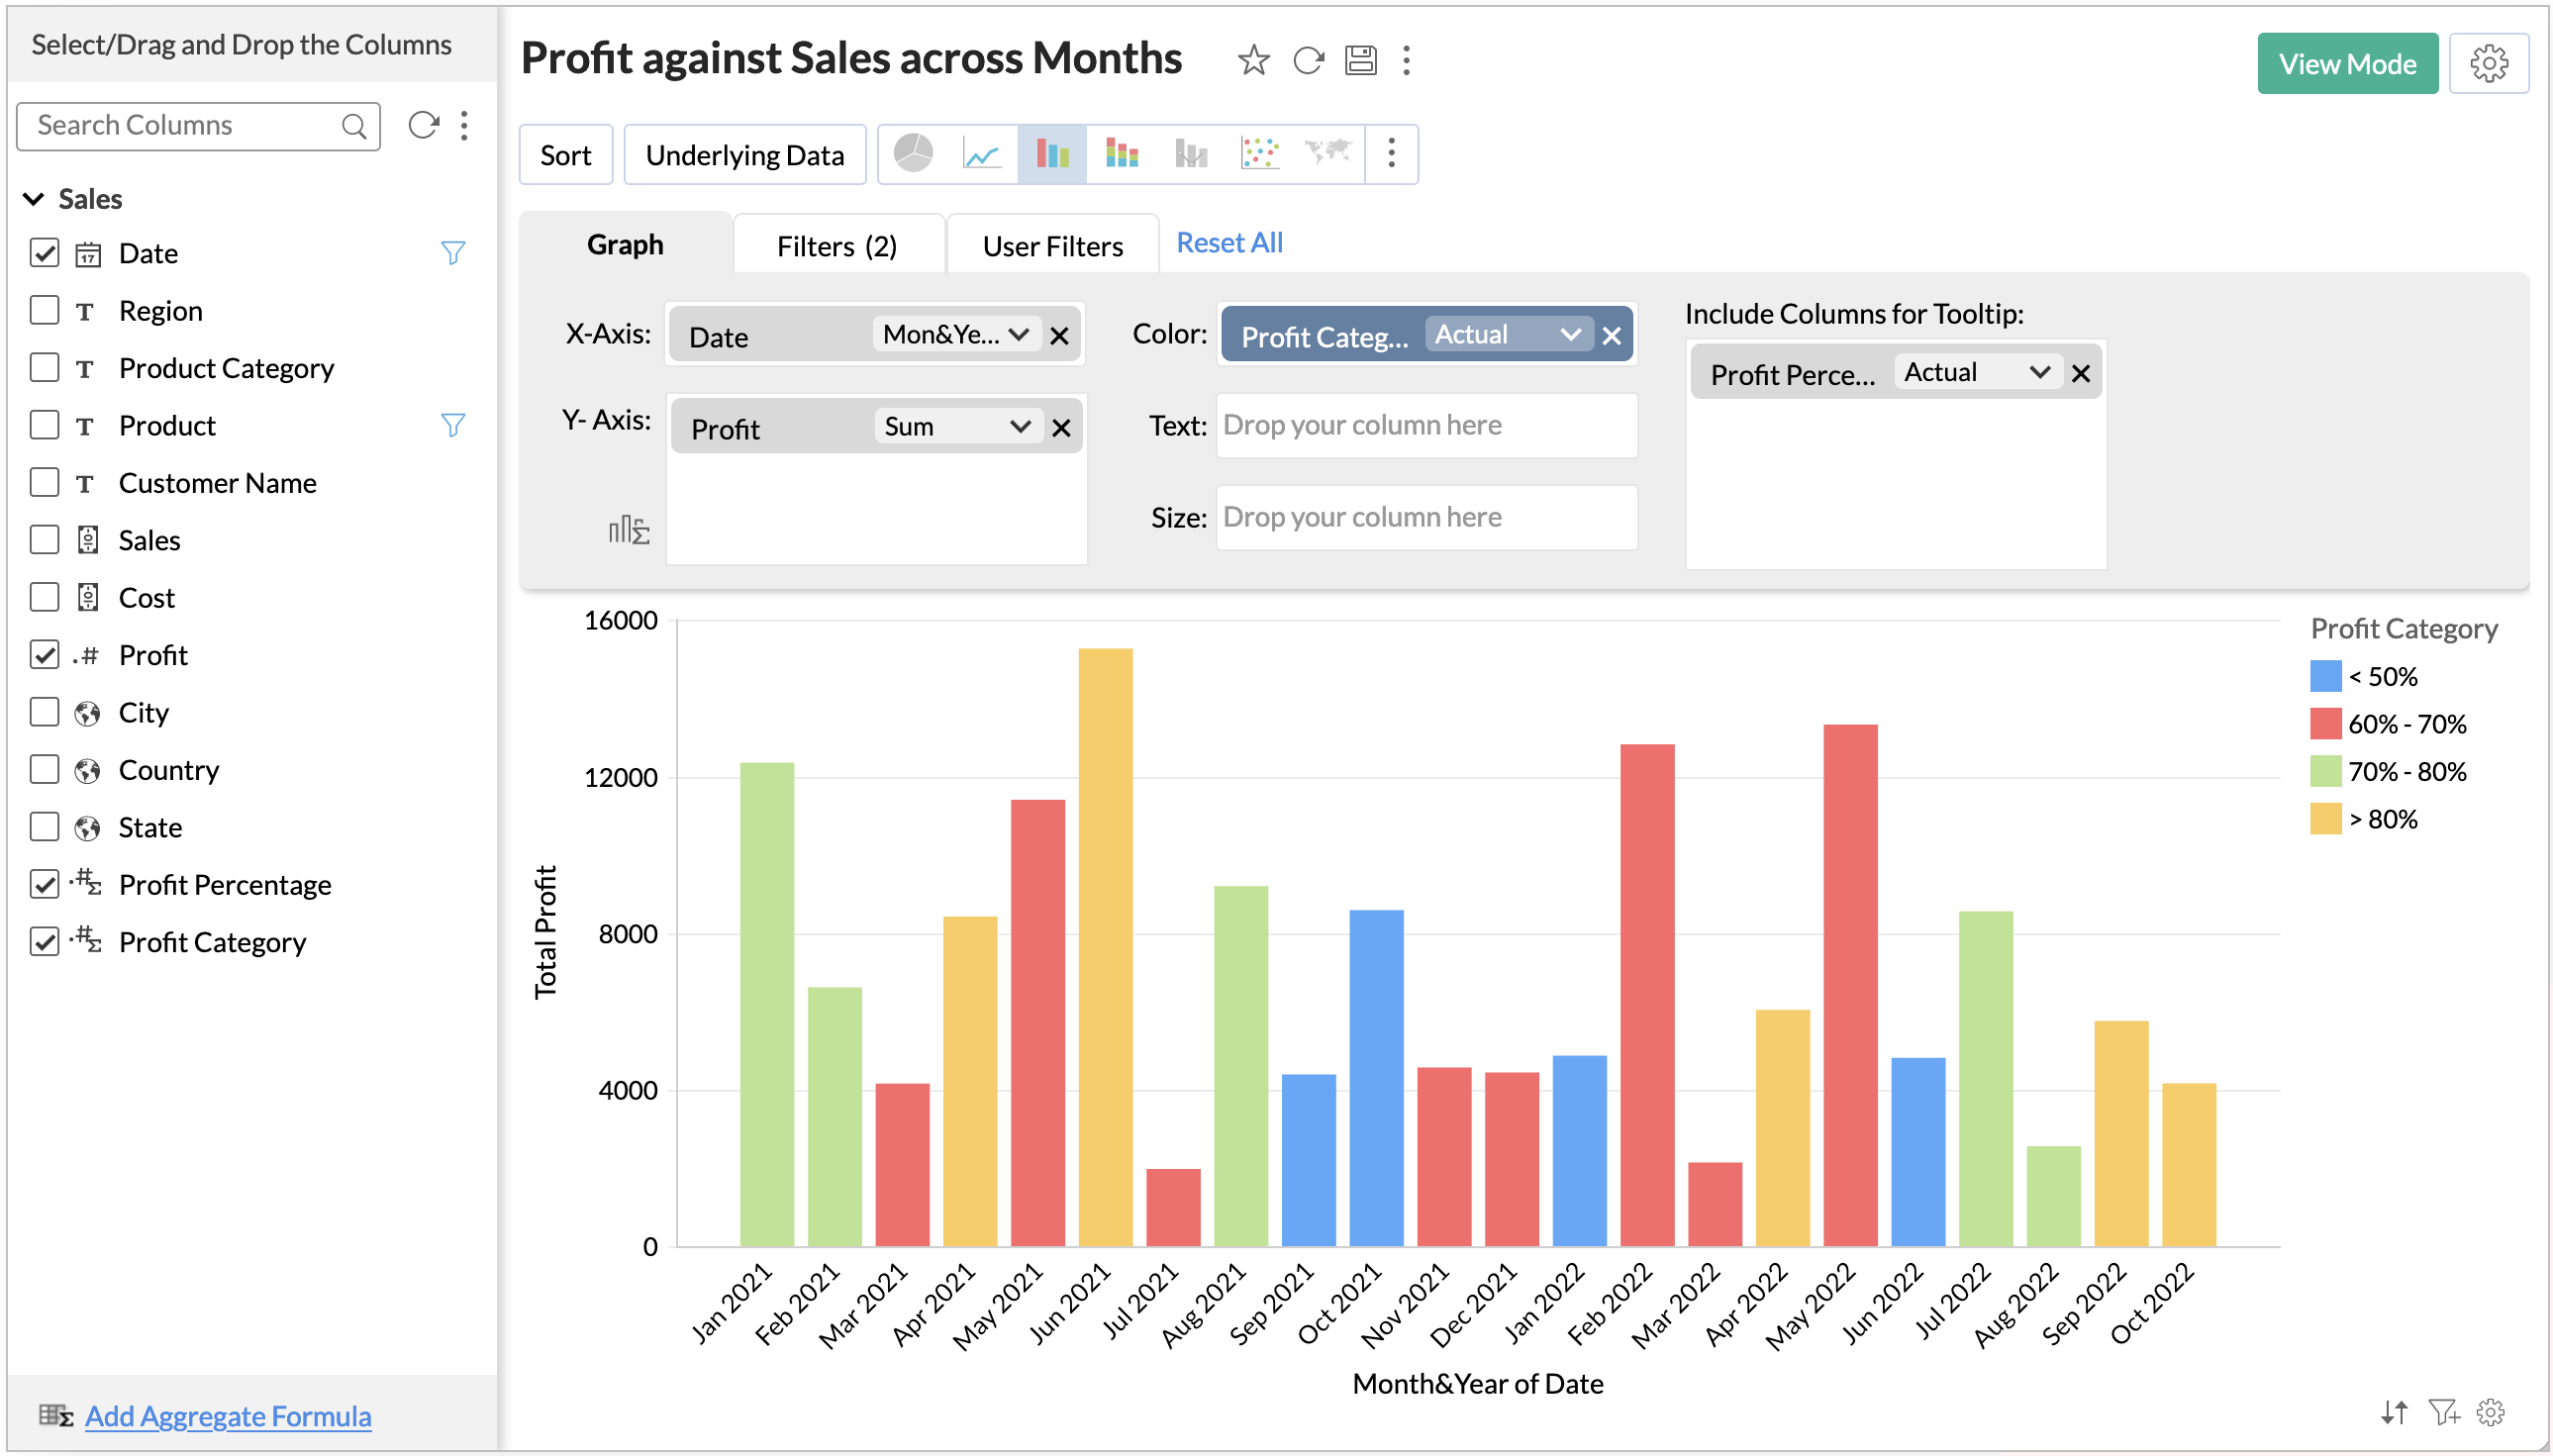
- Open chart settings and customize the Legend.
-
Your final chart is ready.
We believe this will be useful for you. Stay tuned for more nifty tips.
All-in-one knowledge management and training platform for your employees and customers.
Zoho Developer Community
Topic Participants
Janani Thakshayani
Nora
Ekaterina
Naresh Kumar K K R
Enrico Baumgart
Sticky Posts
What's New in Zoho Analytics - January 2026
Hello Users! We are starting the year with a strong lineup of updates, marking the beginning of many improvements planned to enhance your analytics experience. Explore the latest improvements built to boost performance, simplify analysis, and help youWhat's New in Zoho Analytics - November 2025
We're thrilled to announce a significant update focused on expanding your data connectivity, enhancing visualization capabilities, and delivering a more powerful, intuitive, and performant analytics experience. Here’s a look at what’s new. Explore What'sWhat's New in Zoho Analytics - October 2025
Hello Users! We're are back with a fresh set of updates and enhancements to make data analysis faster and more insightful. Take a quick look at what’s new and see how these updates can power up your reports and dashboards. Explore What's New! ExtremeWhat’s New in Zoho Analytics – September 2025
Hello Users!! In this month’s update, we’re raising the bar across multiple touchpoints, from how you bring in data, plan and track projects to how you design and brand your dashboards. We’ve added the all-new Gantt chart for project visualization, expandedAnnouncing Agentic AI - Ask Zia!
We are delighted to roll out the new agentic AI capabilities in Ask Zia, where every stage of the BI workflow is assisted by AI. With a human-in-the-loop approach, Ask Zia ensures that you’re in command of the decision, while AI handles the complexity.
Zoho TeamInbox Resources
Zoho CRM Plus Resources
Zoho Books Resources
Zoho Subscriptions Resources
Zoho Projects Resources
Zoho Sprints Resources
Qntrl Resources
Zoho Creator Resources
Zoho CRM Resources
Zoho Show Resources
Get Started. Write Away!
Writer is a powerful online word processor, designed for collaborative work.
-
オンラインヘルプ
-
Webセミナー
-
機能活用動画
-
よくある質問
-
Ebook
-
-
Zoho Campaigns
- Zoho サービスのWebセミナー
その他のサービス コンテンツ
Nederlandse Hulpbronnen
ご検討中の方
Recent Topics
Power up your Kiosk Studio with Real-Time Data Capture, Client Scripts & More!
Hello Everyone, We’re thrilled to announce a powerful set of enhancements to Kiosk Studio in Zoho CRM. These new updates give you more flexibility, faster record handling, and real-time data capture, making your Kiosk flows smarter and more efficientChanges to the send mail Deluge task in Zoho CRM
Hello everyone, At Zoho, we continuously enhance our security measures to ensure a safer experience for all users. As part of our ongoing security enhancements, we're making an important update on using the send mail Deluge task in Zoho CRM. What's changing?Change eMail Template for Event-Invitations
Hello ZOHO-CRM Team How I can change the eMail Template for Event-Invitations? I work with the German Version of the Free Version. I know how I can modify eMail alerts or Signature Templates, but where I can other eMails modify you send out? Thank youWorkdrive Oauth2 Token Isn't Refreshing
I have set up oauth for a bunch of zoho apis and have never had a problem with oauth. With workdrive i am using the exact same template i usually use for the other zoho apps and it is not working. All requests will work for the first hour then stops soHow can I import OLM to Yandex Mail easily?
For migrating Mac Outlook OLM data to Yandex Mail efficiently, the Aryson OLM Converter is a reliable professional tool that ensures complete data integrity throughout the process. Unlike manual methods, which can risk inconsistent formatting or missingIntroducing Radio Buttons and Numeric Range Sliders in Zoho CRM
Release update: Currently out for CN, JP, AU and CA DCs (Free and standard editions). For other DCs, this will be released by mid-March. Hello everyone, We are pleased to share with you that Zoho CRM's Layout Editor now includes two new field formats—Is it possible to setup bin locations WITHOUT mandating batch tracking?
Hi fellow zoho users, I'm wondering if anyone else has a similar issue to me? I only have some products batch tracked (items with shelf life expiry dates) but I am trying to setup bin locations for my entire inventory so we can do stock counting easier.Implementing Inventory Process
I am just starting to create an inventory system through Zoho for a nonprofit. We receive in-kind donations of items for kids, and utilize them in 2 or 3 different programs. Then families come in and take the items. I'm thinking of this structure: OurBest way to start zoho inventory with bulk openning stock
We are already using zoho book since long time for cars trading company. Now to streamline more, would like to import the excel data of closing stock of inventory to zoho inventory and to start on. Since we need to track each VIN (unique vehicle id number)Service Reports.
Hello Team, I have a requirement to create multiple service reports for a single AP. That means, in one AP I have 5 service line items, and all line items are linked to assets. Once I complete the AP, I want to generate 5 individual service reports, oneBlueprint enhancements - Parallel and multiple transitions, and more
Last modified on Sep 4, 2023: All Zoho CRM users can now access these enhancements. Initially, these features were available only on an early access basis and by request. However, as of August 2, 2023, they have been made available to all users in allItem Bulk Edit - Allow for Reorder Level
We're implementing a process for using the Reorder Level field for Items, and I have to go through and add this value to a huge chunk of our Items. It's driving me bonkers that I have to do this individually through the UI rather than bulk updating. ItZoho CRM || Unable to Bulk Assignment of Territories for Contacts
Dear Zoho CRM Support Team, I hope this email finds you well. We recently performed a bulk upload of Contacts into Zoho CRM using the official sample Excel template downloaded from the CRM. The upload itself was completed successfully; however, we encounteredWhat's New in Zoho Inventory | August – October 2025
Hello customers, The last quarter has been incredibly productive! We've released a powerful slate of new features and enhancements in Zoho Inventory designed to give you better control, greater efficiency, and expanded functionality across your inventoryDisable Zoho Inventory Tracking / Delink Zoho Books & Inventory
We have integrated zoho inventory with zoho books? Now after a long time, we want to disable inventory tracking and delink these 2 modules. Zoho says we cant do it. Anybody else going thru the same ? Any possibility at all? Why does zoho not allow toAllocating inventory to specific SO's
Is there a way that allocate inventory to a specific sales order? For example, let's say we have 90 items in stock. Customer 1 orders 100 items. This allocates all 90 items to their order, and they have a back order for the remaining 10 items which couldWork Order wont mark as Completed
I have a couple of work orders that won't mark as completed even when I've marked the Service Appointments as completed fully.From Zoho CRM to Paper : Design & Print Data Directly using Canvas Print View
Hello Everyone, We are excited to announce a new addition to your Canvas in Zoho CRM - Print View. Canvas print view helps you transform your custom CRM layouts into print-ready documents, so you can bring your digital data to the physical world withTracking Non-Inventory Items
We have several business locations and currently use zoho inventory to track retail items (sales and purchase orders). We were hoping to use zoho inventory to track our non-inventory items as well (toilet paper, paper towels, etc). I understand that wePrice Managment
I have been in discussions with Zoho for some time and not getting what I need. Maybe someone can help explain the logic behind this for me as I fail to understand. When creating an item, you input a sales rate and purchase rate. These rates are justSet Warehouse based on Vendor
Greetings. I would like to set automaticaly the Warehouse based on the Vendor. Context: I am working on an adaptation of a Purchase Order to be used as a Quotation. I have defined that when a user has to raise a quote the Vendor will be "PROCUREMENT" I would like to set the Warehouse to a predefined value when "PROCUREMENT" is set as Vendor. I have tried to do with the Automation feature using the Field Update option, but Warehouse does not is listed as a field. Can you help? Thanks in advance.How to add interviews through API
I'm trying to add an interview without much luck. The documentation gives examples of adding just about everything except an interview. However, the issue might be the way I'm formatting it, because the documentation is unclear to me. It seems as if the xml should be passed in the url, which seems unusual. I've tried the data as both plain and character escaped, but nothing seems to work, nor do I even get an error response. https://recruit.zoho.com/recruit/private/xml/Interviews/addRecords?authtoken=***&scope=recruitapi&version=2&xmlData=<Interviews> <rowDeprecation of the Zoho OAuth connector
Hello everyone, At Zoho, we continuously evaluate our integrations to ensure they meet the highest standards of security, reliability, and compliance. As part of these ongoing efforts, we've made the decision to deprecate the Zoho OAuth default connectorAuto tagging
Some of the articles I enter into Notebook get there when I enter them in Raindrop.io and IFTTT copies the articles in Notebook. When this happens the notes are tagged but instead of useful one word tags with topic the tag pertains to the specific articleKaizen #210 - Answering your Questions | Event Management System using ZDK CLI
Hello Everyone, Welcome back to yet another post in the Kaizen Series! As you already may know, for the Kaizen #200 milestone, we asked for your feedback and many of you suggested topics for us to discuss. We have been writing on these topics over theHow do I save audio files to my PC that I record into Zoho Notebook from my phone?
I was thinking of using Zoho Notebook as a way to store composition ideas, as well as for other things if it can handle this. For this to be useful for me though, I need to be able to have an easy way to download those audio files to my PC, either individuallyHow to filter subform report based upon main form report in dashboard
Hi Team, I am creating a dashboard in Zoho Analytics. I want to have a main form report and below I want to show subform report of main form. If I filter the main form with date then I want to show subform records based upon main form. how can I achieveSearch mails in shared mailbox
Hi everyone, is there a way to search mails in shared mailbox's? Search in streams or mail doesn't return anything from mails in shared mailboxes. Thanks! RafalZoho CRM for Everyone's NextGen UI Gets an Upgrade
Hello Everyone We've made improvements to Zoho CRM for Everyone's Nextgen UI. These changes are the result of valuable feedback from you where we’ve focused on improving usability, providing wider screen space, and making navigation smoother so everythingKaizen #186 : Client Script Support for Subforms
Hello everyone! Welcome back to another exciting Kaizen post on Client Script! In this edition, we’re taking a closer look at Client Script Support for Subforms with the help of the following scenario. " Zylker, a manufacturing company, uses the "Orders"Fail to send Email by deluge
Hi, today I gonna update some email include details in deluge, while this msg pops up and restrict me to save but my rules has run for one year. can you tell me how to use one of our admin account or super admin account to send the email? I tried to updateWriting SQL Queries - After Comma Auto Suggesting Column
When writing SQL Queries, does anyone else get super annoyed that after you type a comma and try to return to a new line it is automatically suggest a new column, so hitting return just inputs this suggested column instead of going to a new line? AnyoneIntroducing Multiple Sandbox Types and Support for Module's Data Population
Register here for the upcoming Focus Group webinar on Multiple Sandbox | Help documentation to learn more about the new enhancements Hello everyone, Sandbox in CRM is a testing environment for users to create and test new configurations like workflowIs It Possible to Convert a Custom Module to a Quote?
I recently created a custom module in our CRM environment for RFQs so that our sales team can submit quote requests directly in Zoho rather than by email/phone. This allows for a cleaner overall process, minimizing potential errors and potentially encouragingConvert invoice from zoho to xml with all details
How to convert an Invoice to XML format with all detailsImporting into the 'file upload' field
Can you import attachments into the file upload field. I would expect it to work the same way as attachments do, But can't seem to get it to work.Sync your Products Module for better context.
In customer support, context is everything. The integration between Zoho Desk and Zoho CRM helps your sales and support teams function as one, delivering better customer experiences. With the latest update to this integration, you can now sync the Product module in your Zoho CRM with your Zoho Desk portal. This feature enables products from Zoho CRM to reflect in the "product" field in Zoho Desk. This can save your support team valuable time and effort. Some things to note when syncing the two:Where is the desktop app for Zoho Projects???
As a project manager, I need a desktop app for the projects I manage. Yes, there's the web app, which is AWESOME for cross browser and platform compatibility... but I need a real desktop app for Projects that allow me to enter offline information whereAutomating CRM backup storage?
Hi there, We've recently set up automatic backups for our Zoho CRM account. We were hoping that the backup functionality would not require any manual work on our end, but it seems that we are always required to download the backups ourselves, store them,CRM verify details pop-up
Was there a UI change recently that involves the Verify Details pop-up when changing the Stage of a Deal to certain things? I can't for the life of me find a workflow or function, blueprint, validation rule, layout rule ect that would randomly make itNext Page


