Account overview dashboard
The account overview dashboard is the face of the ABM tool. It gives a panoramic view of your accounts, their performances, and their behavior on a single page.
Let's look at these insights in four sections.
Section 1: Key performance indicators
Total accounts shows the number of accounts that are present in your Zoho ABM tool.

Note: If you have not specified your account preference via Global criteria, ABM can let in and process up to 2,00,000 accounts for Enterprise and Zoho One and 500,000 records from Ultimate and Zoho CRM Plus, respectively from Zoho CRM.
Total revenue generated shows the revenue generated by accounts participating in this ABM program thus far.
Note:
The currency displayed in this component is coming from the primary currency settings in your Zoho CRM organization.
Number of New accounts that match the global criteria added in the last 6 months to your Zoho CRM organization is displayed to understand the expanse of your target accounts.
Top accounts based on revenue ranks accounts based on their revenue contribution. This is a dynamic insight as the contribution will vary based on the performance of each account.
Accounts closing this month
lists accounts that are near conversion. That is, the ABM tool will look for open deals with closing dates for this month and list all the related accounts chronologically. This will help you know accounts that have potential to bring revenue this month.
lists accounts that are near conversion. That is, the ABM tool will look for open deals with closing dates for this month and list all the related accounts chronologically. This will help you know accounts that have potential to bring revenue this month.
Notes: All the accounts taken into computation are all active accounts. Accounts that are dormant or those that doesn't fit to the global criteria any more, will be removed from the ABM tool.Suggested Segments suggests segments based on predefined segmentation criteria. By the type of accounts applicable, this dashboard in the overview will show the potential revenue from strategies like expansion and retention.
Section 2: Comparative study using visual charts
Revenue based on closing date
is an analytical chart that shows accounts' revenue over time. You can ascertain when in the year, there was a revenue spike and when there was a dip in the returns. This chart reveals your business' seasonal turnovers.
is an analytical chart that shows accounts' revenue over time. You can ascertain when in the year, there was a revenue spike and when there was a dip in the returns. This chart reveals your business' seasonal turnovers.
Account acquisition trends shows the number of accounts created each month. You can look at when in the year there were more acquisitions and when there were less to none. You can correlate this chart with your historical engagements and investigate the reason behind this flux in their acquisition, like if the sales outreach was less at those times or it was a seasonal downtime for your business type and so on.
Top 5 industries based on accounts will list industries that are major consumers of your business. This insight will help you tailor offerings around these industries for enhanced conversions. 
Account distribution based on revenue categorizes the accounts based on their revenues. This will enable you to understand and compare the top players in your pool of accounts.
Section 3: Intelligent analyses by Zia
In addition to the standard computation, ABM also brings Zia's intelligent analyses to understand intricate patterns in your accounts.
- Trending products
- Voice of the Customers
Trending Products:
Your account module might be directly or indirectly connected to your products module as a result of module mapping. Using this connection as a cue, Zia will understand the historical deals created for your accounts, look at the products participating in those deals, and rank the top five products your accounts have in their deals. With this information, you can decide upon demand-pricing, pair it with products that are moderately selling or with products that work well in terms of functionality, or simply have those products always in stock. Also, you can set the desired duration and view products trending at those times for historical analyses.
Furthermore, owing to Zia's intelligence, this insight can also be used as a parameter in preferences for the recommendation segmentation technique.
For example: Zylker is an educational institute that offers a list of executive programs for enterprise organizations. The organizations (their accounts) in association often times prefer to subscribe to courses based on the tech trends of the season or based on the audits their company runs at the time. With this trending products components in display, Zylker can ascertain the popular courses businesses are subscribing to at the moment, optimize their course syllabus, or even suggest the fellow organizations subscribe to the trending courses as an upsell. In addition, you can also strategize the future offerings based on the historical trends observed in the accounts.
Voice of the customer (VoC)
Voice of the customer is a feature that takes you closer to your customers' experience. It help you gather customer feedback from various channels, showcases the first party intent of customers and help conduct intrapersonal analysis on their opinions on your business.
It will display a host of charts in the VoC dashboard within the accounts master page. For it to display charts based on various correspondence attributes, it is expected to connect your CRM with Zoho Survey, Zoho Desk, and Email. You can choose the time frame from when you want to gather the feedbacks from and the data type—if you want to conduct analyses based on contact count, account count, or response count as a whole.
Upon configuring, the following charts are displayed to help you understand experience from your customers' feedback.
Overall response/ contact/ account count by sentiment: This is a pie chart representation of total sentiments observed in responses, from contacts, or accounts. The following chart tells you the distribution of positive, negative, and neutral sentiments observed in your contacts. From the overall 8 sentiments observed, 3 contacts exhibited positive sentiments, 4 contacts experienced negative sentiments, and 1 contact exhibits neither positive not negative sentiments. The unique contacts represents the actual number of contacts participating in the analysis, and the difference of 3 from the overall 8 sentiments have responded both positively or negatively or neutrally.
Overall response count by intent:
This chart classifies contacts, accounts, or their responses based on their intent. Intents are your customers' intention/ purpose as they correspond with you. It can be request, complaints, purchase, or such. Classifying your contacts, accounts, or responses based on intents will help you identify the majority reason as to why they reach you. Here's more information about email intents in Zoho CRM.Competitor overview:
Based on the constant learning, Zia comes up with competitor information; thus, when a customer mentions them in any of the correspondence, those are captured and analyzed. This chart distributes the percentage of competitor mentions observed thus far. You can ascertain which player in the market is a threat and which are not. Using this information, you can understand their offering, compare with yours, and improve your positioning or placement.Frequently occurring keywords by sentiment:
Keywords are unintentional cues from where you can read customer sentiments. It can reveal sentiments, expectations, and problems. All those frequently uttered keyword by customers are parsed from the correspondences and based on their frequency, they are portrayed as a cloud with words in varying prominence.By accessing the sentiment preferences from the option up top, you can also choose what kind of word cloud, you'd like to view—either based on sentiments or occurences.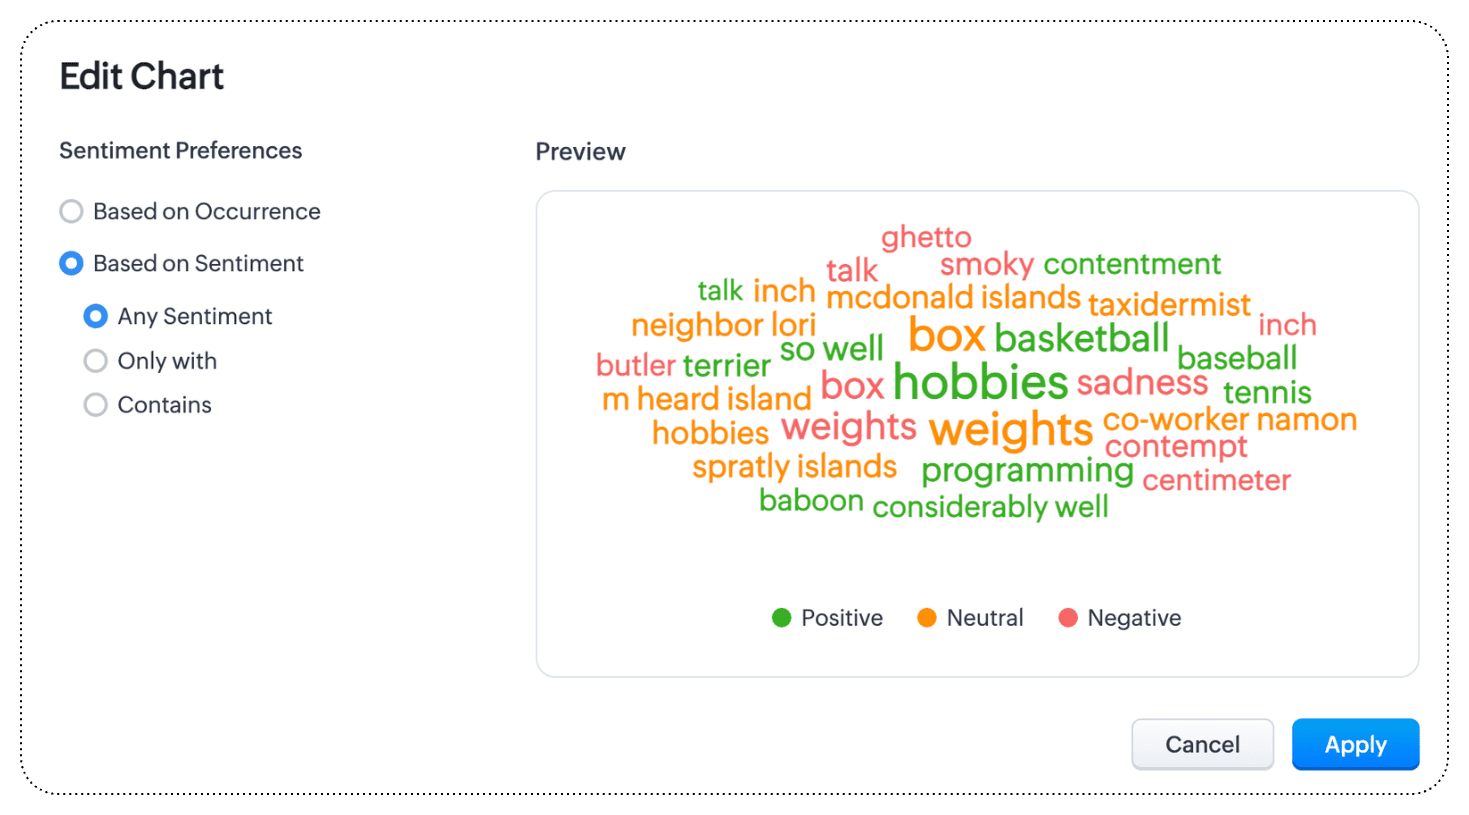
All keywords tabular view: The tabular view will tabulate the same keywords as the table, distribute the source of those words, and rank them based on the severity and frequency.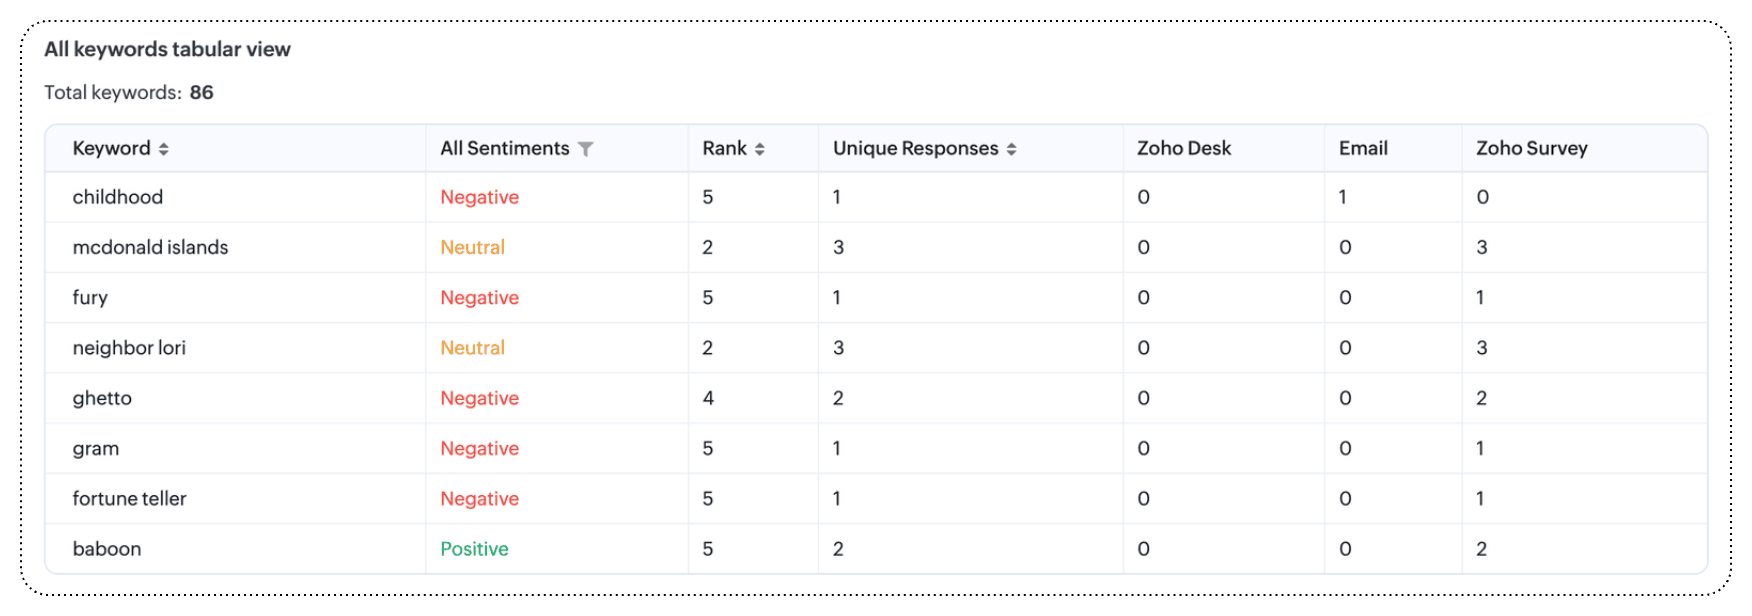
All keywords while mentioning the competitor tabular view: This table shows the competitor mentions and what keywords were used when they mention and what sentiment was observed.
Section 4: Account list view and advanced filters
The account list view houses all the accounts in your business. These accounts are either a direct transfer of all accounts from Zoho CRM or those that are qualified by the global criteria. Click here to learn about global criteria.
In this list view, you can do the following actions:
- View total records in your ABM tool. This total count gives you a quick understanding of the list of accounts acquired by your business.
- Search for accounts based on their names. In the pool of accounts, you can search for the desired account by name, and the result will be listed in the list view.
- Manage columns. You can add more columns and arrange their order based on your preference.
- Filter accounts by score, by segmentation techniques applied, by fields and their values present in each record.
- Create a segment directly from the filters. Quickly create segments from the resultant accounts after filtering.
Thus, the account overview page along with the VoC insights will offer you with the intelligence about your accounts facilitating contextual and meaninful targeting of the segments.