Format a Chart
Each chart you add to your slides is unique and presents data in a different way. You can choose to customize your charts using a variety of chart formatting options (styles, designs, and layouts, or change color, borders, axis ticks, labels) to make them more visually attractive and to highlight impressive data.
Format chart layout properties
Change chart presets
You may wish to change or move the default location of your row and column values or legends on your chart. You can choose a layout from a list of preset options which works for your presentation and apply it to the chart. Presets is a collection of pre-defined layouts with the chart elements arranged in different locations around the chart. For example, you can have a preset type to display legends either on the top, bottom, or on the right of the chart.
1. Select the chart.
You will see the FORMAT mode with chart formatting options on the right pane.
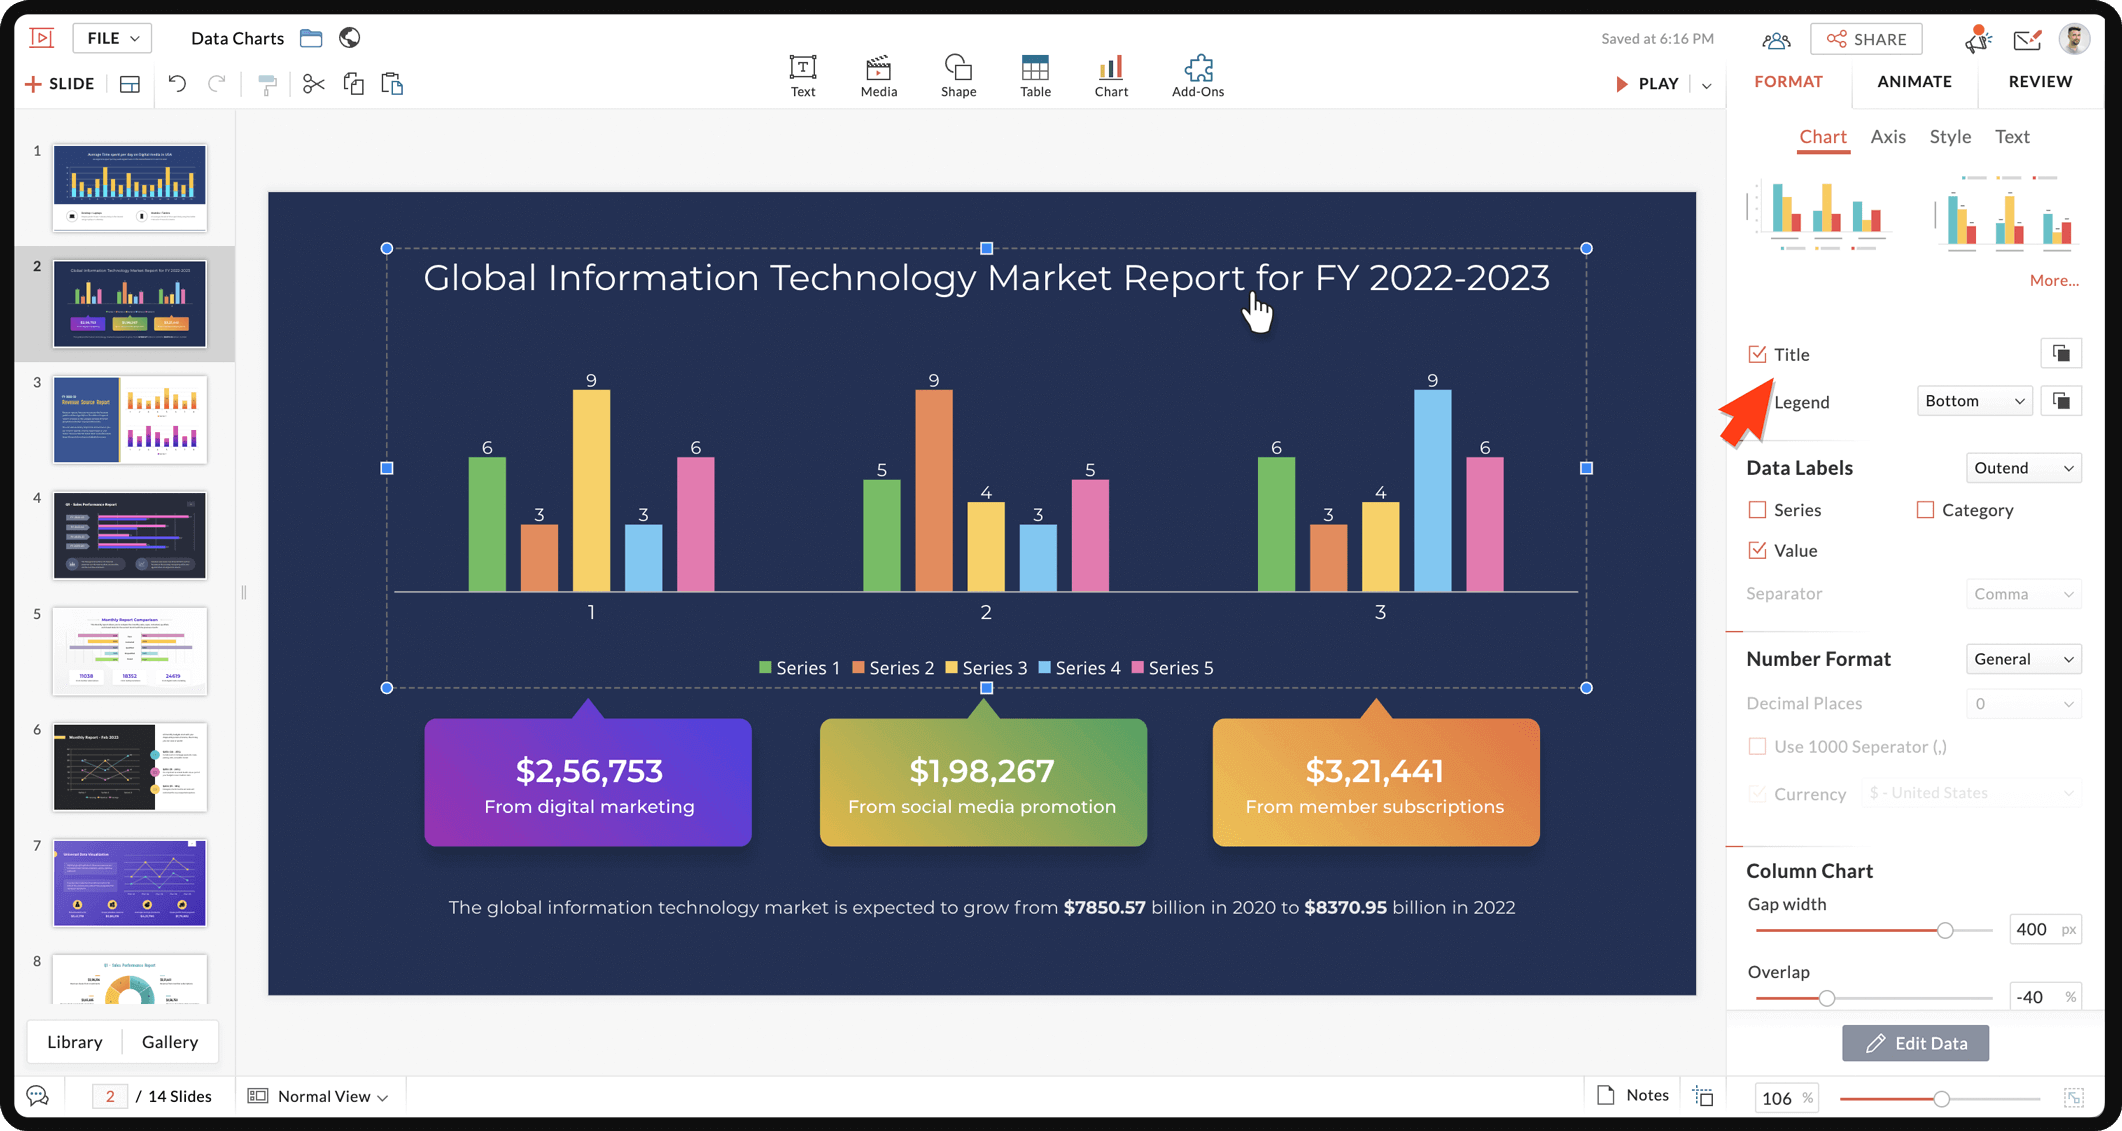
2. Select the Chart tab within the pane, click More... and choose the preset type you want to apply.
The chosen style will be applied to your chart.
Add and position chart title/legend
When you insert a chart, you will see the Title and Legend at their default positions outside the chart. The chart title is name that describes your chart and the chart legend is a key to understand what data is indicated by the colors used in the chart. You can choose to hide, show, or change the location of the title and legend within the chart.
1. Select the chart.
You will see the FORMAT mode with chart formatting options on the right pane.
2. To add a title, click the Chart tab within the pane and enable the Title checkbox.
Your chart title appears in the top of the chart. You can also enable the Overlap button to set how much the title overlaps with the axis values.

You can format the chart title text using the Text tab on the right pane. This includes changing the font style, size, font face, etc. Learn how to format text.
3. To add a legend, enable the Legend checkbox and click the Position drop down to choose legend position's i.e., right, left, top, or bottom.
Add and position data labels
Adding a data label helps make your chart more informative by specifying the data or value for individual series or category in the chart without needing to search for specific data along the axis. For example, in a pie chart, adding data labels immediately identifies each data value as a ratio or percentage of the total.
1. Select the chart.
You will see the FORMAT mode with chart formatting options on the right pane.
2. Click the Chart tab within the pane and enable the type of Data Label checkbox you want to add from:
Series: Displays the name of the Series in the data label.
Category: Displays the name of the Category in the data label.
Value: Displays the data values of the Series in the data label.
Percentage: Displays the percentage values of the data in the chart. This option is available when you add any variety of pie chart.
3. To choose your label position, click the label position dropdown next to Data Label and select the location for your data label.
Four positions are available:
Center: Places the data labels in the middle of each data point.
Inbase: Places the data labels at the bottom of each data point.
Inend: Places the data labels at the top of each data point.
Outend: Places the data labels above of each data point.
For stacked or area charts, you can choose to place the labels at the top, center, left, right, or bottom area of each data point.
4. To add a label separator, click the Separator dropdown and select the type of separator you want to add from: comma, semi colon, period, newline, or space.

This option is only enabled when you select two or more label checkboxes for your chart. It determines the symbol that is used to separate different elements within the data label. The image shows the data labels for the chart series displaying values and the series name separated by a newline.
Number format
Choose the type of numerals you would like to follow for your chart. You can also add "000 comma separator" and if the data involves currency you can choose to add it too.
1. Select the chart.
2. From the right pane click FORMAT.
3. Check the Value box within Data Labels.
4. In the Number Format dropdown select from General, Number, Percentage or Fraction.
5. Manually enter or use the dropdown to choose the number of digits after the decimal.
6. Check the Use 1000 separator box to use a comma after the 1000th place.
7. Check the Currency box to choose between Dollars, Euro, Rupees, and Pounds.
The Use 1000 separator and Currency will be applicable only if you choose Number from the Data Labels.
Adjust spacing (gap width) on bar and column charts
On bar and column charts, you can set the distance and width for all the bars and columns in the chart. The gap width is the space between two set of series or columns in the chart. You can also adjust the distance between individual bars and columns in a category or data series. This helps clearly differentiate between various series and category data.
1. Select the chart.
You will see the FORMAT mode with chart formatting options on the right pane.
2. Click the Chart tab within the pane and carry out any of the following actions in the Column Chart field:
To change the space between bars , move the Gap width slider, type in a desired value in pixels, or click the pixel arrows in the Gap text box.
To change the space between categories, move the Overlap slider to set the bar thickness as a percentage or type in a desired value in the text box. You can also the up-down arrow to increase or decrease the space between the bars, which will make them thicker or thinner.
Resize a chart
By default, the chart you add to your slide will be positioned within a placeholder that appears as a box with a dotted border. You can use the handles to stretch or shrink the size of your chart so that it fits neatly with the other objects on the slide.
Format chart axis properties
In general, axes run along the horizontal and vertical edges of the chart and display the units of measurement for the data in your chart. These units can either be in sequential order or in the specified base units.
Types of axis
Horizontal Axis (or X-axis) : Appears along the bottom of the plot area and contains the name of the category headings in the chart.
Vertical Axis (or Y-axis): Appears to the left of the plot area and contains the units of measurement based on the data values in the chart.
Column, Area, Line, and Bar charts have the category names or data values plotted along either the X or Y-axis based on the chosen chart type. Scatter charts use both the x and y axes for data values.
Pie and doughnut charts do not have axes and cannot display any of the axis properties.
Main parts of Axis: Axis title, axis layout, axis label, axis major and minor, and, axis grid lines. You can choose to show or hide these axis elements while delivering your presentation.
Show or hide an axis title
Axis titles help the users to understand and visualize the data your chart depicts along the axes of a chart. They include the units in the axes (x-axis and y-axis). You can choose to show or hide the axis title at any time.
1. Select the chart.
You will see the FORMAT mode with chart formatting options on the right pane.
2. Click the Axis tab within the pane and do any of the following to add title:
- To add a title to the horizontal (category) axis, click Category and enable the Title checkbox.
- To add a title to the vertical (value) axis, click Value and enable the Title checkbox.
- To hide the axis title, uncheck the Title checkbox for the axis title.
Add axis label (category or value)
The axis label indicates various Categories in the chart along the horizontal axis (X-axis) and data values such as numbers or percentage along the vertical axis (Y-axis).
1. Select the chart.
You will see the FORMAT mode with chart formatting options on the right pane.
2. Click the Axis tab within the pane, choose either the Category Axis or Value Axis to label and check the Axis Label checkbox.
You can add labels to both the axes.
3. Now, click the Axis Label Position dropdown and choose a location to insert your label in the chart.
It includes four positions:
High: When you select the High option for the Category axis, the axis labels move above the plot area. When you select it for the Value axis, the axis labels move to the right side of the plot area.
Low: When you select the Low option, the Value and Category axes are moved to the left and bottom sides of the plot area. This is the default for most charts. To understand how the Low option for axis label position, you need to have both the value and category axis to cross in the middle of the chart.
Next to Axis: When you select the Next to option for the Value label for a crossed axis chart, the axis labels move to the middle of the chart and when you select it for the Category axis, the axis label moves below or close to the bottom side of the plot area.
None: Removes or hides the axis label for the selected axis.
Set the maximum and minimum of the value axis
You can adjust the scale on the Value axis to display the highest or lowest number on the axis. These options help keep your chart readable. Say, your data does not start from zero, then there is no need to keep the blank space from zero to where the data begins on the chart. Change the minimum value for the axis to avoid this useless empty space. You can have your maximum and minimum starting from a negative number along the axis.
1. Select the chart and click Axis tab on the right.
You will see the FORMAT mode with chart formatting options on the right pane.
2. Choose Value axis within the pane and select the Scale field to set your desired values as follows:
To set the maximum value or number for the axis, type in a value in the Max Value box or use the up-down arrows to increase or decrease the number. This value cannot be lower than the highest value in your data set.
To set the minimum value or the value at the origin point of the axis, type a number in the Min Value box field below Value Axis. This value cannot be greater than the smallest value in your data set.
Change the major and minor units of the value axis
Major and minor units are the space intervals at which the values or numbers are spaced along the value axis in the chart. Using the major units is one of the easiest ways to make your chart readable. Minor units are the spacing between the major units in the value axis and can help locate or indicate data points more accurately in the chart. The difference between the major and minor unit can be seen clearly when you enable the major and minor gridlines.
1. Select the chart and click Axis tab at the right.
You will see the FORMAT mode with chart formatting options on the right pane.
2. Choose Value axis within the pane and select the Scale field to set desired unit values as follows:
To change the major unit, type in a value for the vertical (value) axis in the Major Unit box or use the up-down arrows to increase or decrease the units.
To change the minor unit, type the minor value in the Minor Unit box or use the up-down arrows to increase or decrease the units.
You can change the value axis to show units of hundreds, thousands, or currency values by changing the Display Units.
Add major and minor ticks on the axes
A simple way to represent and identify visually complex data in your chart is by using ticks. The tick marks are lines that appear along the sides of the axes in a chart to help you read the values for the chart data.
There are two types of tick marks: Major Ticks and Minor Ticks.
Major ticks are used to mark important values on the scale and are usually accompanied by a label that displays their value. They appear between the categories on the horizontal axis and besides the major unit values on the vertical axis.
Minor ticks mark less significant values and are usually displayed between the major ticks.
1. Select the chart.
You will see the FORMAT mode with chart formatting options on the right pane.
2. Click the Axis tab within the pane and choose either the Category or Value Axis depending on which axis you want the tick marks to appear on.
3. Under Ticks, enable the Major and/or Minor checkbox.
4. Now, set the position for the ticks along the chosen axis by clicking the Ticks Position dropdown.
You can select one of the following four positions:
Outside: Places tick marks outside of the plot area (outer side of the scale).
Inside: Places tick marks inside the plot area (inner side of the scale).
Cross: Places tick marks overlapping and the axis.
None: Removes the tick marks from the axis.
Add axis gridlines
Gridlines are horizontal and/or vertical lines that divide a chart into smaller grids, making it easier to read values on the chart.
1. Select the chart to add grids.
You will see the FORMAT mode with chart formatting options on the right pane.
2. Click the Axis tab within the pane and choose the Category Axis or Value Axis to add the gridlines.
3. Under Gridlines, select either the Major or Minor checkbox depending on the axis you want to add the grids to.
If there are major and minor tick marks displayed on the axes, the gridlines will be aligned to the tick marks. They appear to emerge from the tick marks.
Format chart design properties
Transform the appearance of your chart by adding colors, patterns, and an outline. This helps you make data values and other chart elements much clearer and easier to read. You can apply colors and borders to make your plot area more prominent and grab the attention of your audience when giving your presentation.
Apply chart style
Instantly apply a preset chart style to change the look and feel of your chart.
1. Select the chart.
You will see the FORMAT mode with chart formatting options on the right pane.
2. Click the Style tab within the pane and then click More... choose your desired style from the list
Your chosen style will be applied to the chart and can be changed at any time.
Apply a chart fill
The charts you add to the slides will have predefined colors, outlines, and effects based on the theme of your presentation. You can customize and redesign your charts to stand out to your audience using a solid fill, picture, or a pattern as the background. These fill properties will help you to differentiate various categories or series and read the charts clearly when displayed on a projector or TV screen.
1. Select the whole chart or click an individual series or category element to a fill background to.
You will see the FORMAT mode with chart formatting options on the right pane.
2. Choose the Style tab within the pane and from the dropdown choose either of these Chart Area, Plot Area, Legend, XAxis, YAxis, YAxis Title to apply fill.
3. Use the dropdown next to Fill to apply one of the below-
There are four types of background fills: Solid Fill, Gradient Fill, Picture Fill, and Pattern Fill.
- Choosing a Solid Fill applies a single color uniformly within the whole chart.
- Choosing a Gradient Fill applies a continuous blend of two or more colors. Choose the color of gradient to apply from the top band and select a lighter or darker shade of the color in the gallery.
- Choosing a Picture Fill applies a picture as a chart fill. Choose a tile pattern from this gallery or add your own picture as a background using the Image section on the top bar.
- Choosing a Pattern Fill applies a pattern as a chart fill. Choose a pattern from this gallery and customize the foreground and background shades.
- Choose None to remove the fill from your chart.
3. You can use the Transparency slider to set transparency.
Apply a chart border
Adding a border or outline to the chart helps to emphasize it on the slide. You can pick from a variety of stroke styles and customize the color, thickness, and transparency of the border. You can also select a soft or a flat edge for your line.
1. Select the chart.
You will see the FORMAT mode with chart formatting options on the right pane.
2. Click the Style tab within the pane and from the dropdown choose either of these Chart Area, Plot Area, Legend, XAxis, YAxis, YAxis Title to apply stroke.
3. Enable Stroke button and choose a color for your stroke border.
4. Adjust the thickness of the outline, its transparency, and the style of stroke end.
Format text elements in a chart
Highlight the text elements in your chart by changing the font face, style, weight and color.
1. Select the chart.
2. From the right pane click FORMAT and select Text within it.
3. From the Text Element dropdown select the Text you prefer to format.
You can also click on the text element in the chart to format it.
Font color: Next to Font, click the color palette to choose a color of your choice from Theme colors, Standard colors, or Advanced color palette.
Font face: From the Font dropdown select a font face.
Font Style: Once you have selected the font, use the dropdown to select the font style (Light, bold, Semibold, Normal). This will differ according to the font selected.
Font size: From the dropdown select the size of font, or manually enter the preferred size. You can also use the  and
and  to increase or decrease the font size.