Configuring and managing gauges
What does this page cover
Availability
- Gauges can be created in all plans of Creator.
- Only the super admin, admins, and developers can create and manage gauges.
1. Setting up gauges
1.1. Steps to add a gauge and configure its display
1. Navigate to the page builder of the required page and click Gauge on the left pane. A list of gauge templates appears alongside.
2. Drag and drop a gauge template onto the builder space. The Gauge Configuration pane, which can be called as the gauge builder opens. You can configure the display and style properties of the gauge from here.
3. Choose an option under the Display value dropdown from Sum, Minimum, Maximum, Median, Average, Count, and Distinct Count (counts unique field values). After choosing an arithmetic operation, configure it using the data stored in a Zoho Creator form by following the below steps:
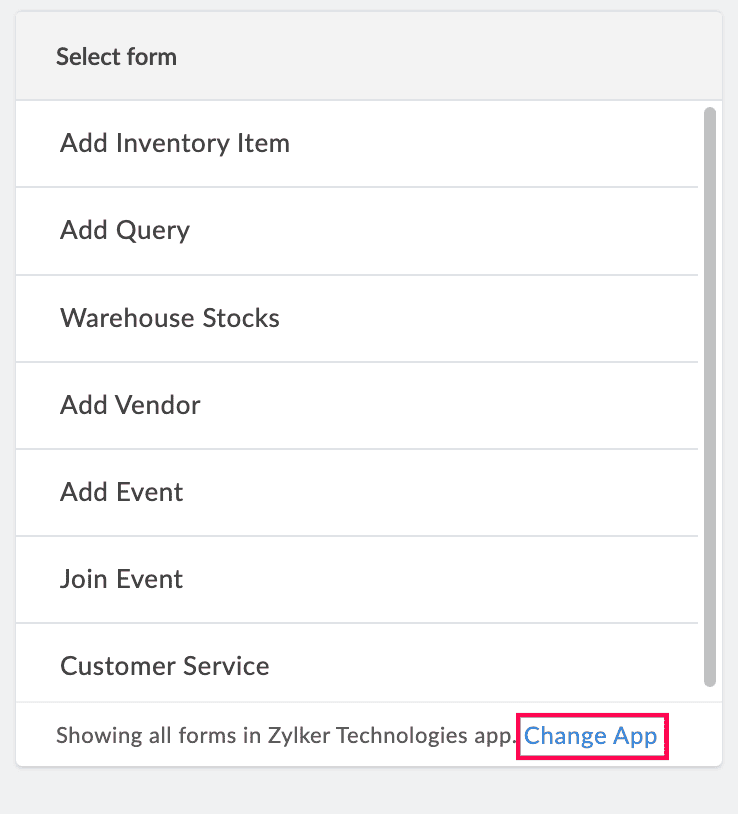
i) Select a form whose data based on which this arithmetic operation needs to be configured.

Note: The Select form dropdown lists all the forms in the application you are currently working on. To select a form from another application, click Change App in the footer of the form dropdown. Select another application and click Done to view all of its forms.
ii) Choose a numeric field from the Select field dropdown whose record data based on which the arithmetic operation will be configured.
Note: If there is only one numeric field available in that form, it will be auto-selected by default.
iii) Choose which records you want to evaluate for the arithmetic operation:
- All records - Evaluate all the records from the selected form
- Selected records - Evaluate a specific set of records that satisfy a criterion, to configure the operation.
If the display value of the gauge is of the NUMBER datatype, you can configure the following properties as well. If not, you can skip to step 4.
i) Depending on the chosen operation, choose if you want to show the dynamic gauge value as:
- Actual (Applicable for all operations)
The actual result of the operation. This is the default value. - Percentage of total (Applicable for Minimum, Maximum, Median)
Say the result of the arithmetic operation is 24 and the sum of all values recorded for that field is 240. Then the displayed percentage will be 10%. - Percentage of a number (Applicable for Sum, Minimum, Maximum, Median, Average, Distinct Count)
Say the result of the arithmetic operation is 30 and the specified value under Numeric Value for the percentage is 120. Then the gauge will display 25%.
- Fraction with the total in denominator (Applicable for Minimum, Maximum, Median)
Say the result of the arithmetic operation is 24 and the sum of all values recorded for that field is 240. Then the displayed fraction will be 1/10.
- Percentage (Applicable for Count)
- Choose a field from the Field dropdown whose values need to be evaluated to calculate the percentage.
- Enter the field values which have to be counted and tallied against the total number of records to find the percentage.
- Fraction (Applicable for Count)
- Choose a field from the Field dropdown whose values need to be evaluated to calculate the percentage.
- Enter the field values which have to be counted and tallied against the total number of records to find the fraction.
4. Enter a maximum value that is displayed as the upper threshold value of the gauge.
5. Enter a target value that is indicated as the goal or value to be aimed at, on the gauge.
Note: The target value can only be lesser than or equal to the maximum value.
6. If a range gauge is being configured, you can further:
- Choose the number of ranges that can be included to differentiate between stages or progress sections on the gauge. The available options are 2 (default value), 3, 4.
- Drag the knobs along the track to adjust the static thresholds of the included ranges. The percentage values of each range are shown dynamically as the knobs are dragged to different positions.
The configurations are auto-saved and will reflect in the live mode.
1.2. Configure style
You can configure style properties for the gauge and the dynamic values displayed on it.
1. Navigate to the page builder of the required page and click Gauge on the left pane.
2. Drag and drop a gauge template from the list that appears alongside onto the building space. The Gauge Configuration pane opens.
Note: If the gauge was previously created, select the gauge from the page builder and click Configure to open the Gauge Configuration pane. Alternately, double click the gauge to open the configuration pane.
3. Navigate to the Style tab on the section on the right.
4. You can style the gauge and the dynamic values displayed on it to create a custom gauge that clearly distinguishes the progress and targets.
|
Property
|
|
Steps
|
|
General
|
Color of the gauge
|
A. Choose the theme color for the chosen gauge.
This might include:
B. Customize the background color of the gauge.
Note: The color options vary from preset colors, the theme color of the application to match overall branding, and custom colors chosen through a color picker.
|
|
|
Font family
|
Choose a font for the statistics displayed on the gauge.
|
(The properties can be configured uniquely for each of the above data)
|
Style
|
Customize the style properties of the data on the gauge such as emboldening and italicizing it.
|
|
|
Color
|
Click the A icon and select a font color for the gauge data.
|
|
|
Font size
|
Click the dropdown to pick a preset font size for the gauge data, from the options 12 - 40 px. Click on the numeric value to set a custom value anywhere between 1 and 99 pixels.
|
2. Managing gauges
From within the gauge builder:
Apart from building the gauge, you can perform the following actions:
- Add Element Name - Click the pencil (
) icon in the top right corner of the Gauge Configuration pane to edit the element's name. This name can be used to locate the specific element in the page builder among others.
- Click the Gauge types arrow (
) and choose another gauge to change it after the configuration is complete. The configurations are retained when the gauge type is switched.
Once you're done configuring the gauge, click the ( ) icon to navigate back to the page builder. You can further manage the gauge from there, such as relocating its position on the page, giving it a live mode title, and more.
From the edit mode of a page:
Click on a gauge to perform the actions mentioned below.
- Adding a gauge title - Click the T icon to give a title for your gauge. This will appear as a heading above the gauge in the live mode of the application. Once inserted, click the gauge title to format it using the below options:
- Font family - Choose from six different font types in the dropdown.
- Font size - Choose a size from 12 - 40 px in the dropdown. The default value is 20px.
- Bold - Click the B icon to embolden the title.
- Font style - Click the I icon to italicize the title.
- Font color - Click the A icon to choose a matching color for the gauge title.
- Update title - Double click the inserted title to update it.
- Remove title - Select the gauge and click the T icon again to remove it.
- Deleting gauge - Click the bin icon to remove the gauge from the page.
- Relocating gauges - Drag and drop a gauge elsewhere on the page builder to relocate it.
Edit or configure an existing gauge:
If you want to edit a previously inserted gauge, select the required gauge in the page builder and click Configure.
3. Related topics
What's next
Previous