Present data graphically with charts

Present data graphically with charts


Hello everyone,

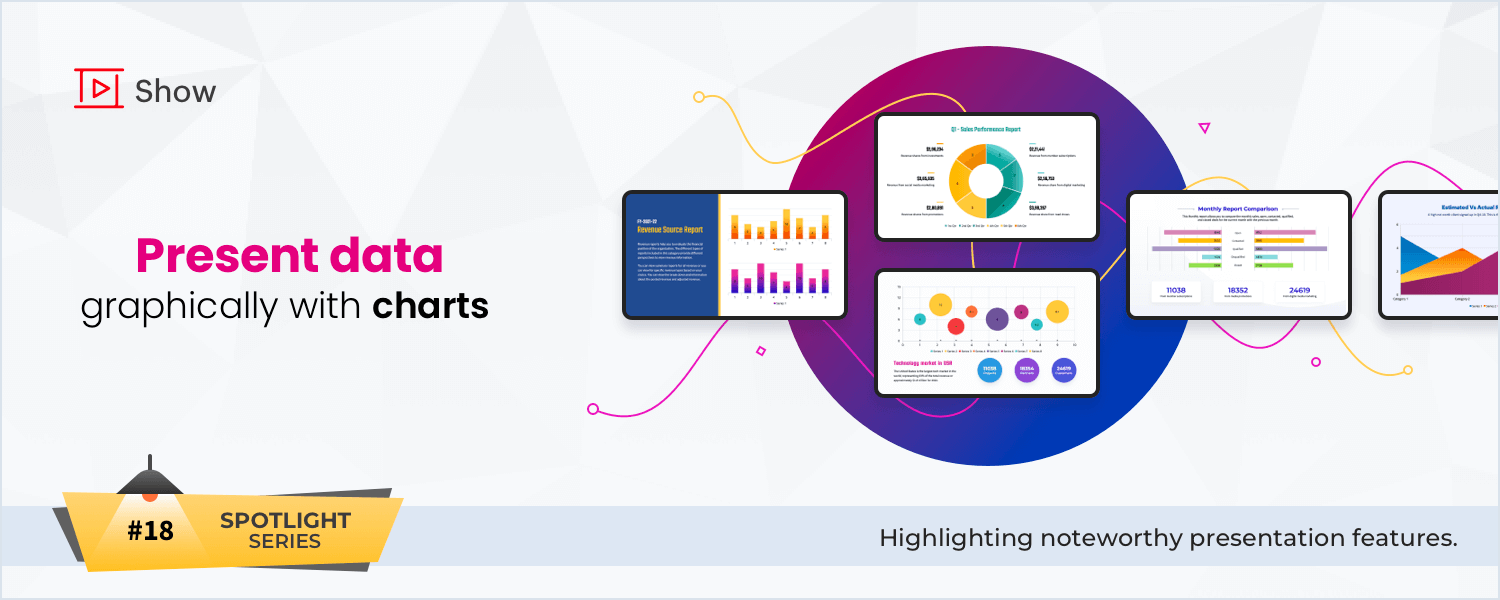
This month's spotlight is on charts.

Data storytelling is an effective way to present information to your audience. The three major components of data story telling are data, narratives, and visuals. While all three depend on the story you want to tell, getting the right visuals is particularly important to convey your story effectively. 

Whether you are presenting your company's total revenue or product sales in different countries, charts can be used to emphasize differences or similarities, track trends, and highlight changes over time. Visualizing the information makes it easy for your audience to follow along and remember key points. 

Charts simplify complex data and also help present it in a concise and consistent style. Zoho Show offers lots of options to improve the overall design of your presentation by making your data visually pleasing and easy to understand. 

Charts in Zoho Show

Show offers various chart types, so you can choose the type of visualization that best fits your data. 

Here's a list of charts available in Show and examples of how they can be used.

Column chart: Show changes over time or compare the performance of different products, segments, or regions.
Bar chart- Compare different categories.
Line chart: Visualize trends and patterns in sales, revenue, or product use.
Area chart: Add depth to a line chart to show how different trends or patterns interact.
Scatter chart: Examine the relationship between two variables.
Bubble chart: Add a third variable to your scatter chart.
Pie chart- Represent the composition of your data.
Area chart- Display the magnitude of change.
Doughnut chart- Represent parts as a whole.
Exploded doughnut chart- Display the contribution of each value to a total.


Elements in a chart

Chart elements are the different parts of the chart that can be customized to make your data story clear and effective. 

Chart area: Entire chart including all the elements
Plot area: Area of a chart that displays your data
Chart title: Description of the data shown
Legend: List that identifies each series of data, typically with color coding
Data labels: Quantities, percentages, or other values affixed to each bar, line, or other visualized data
Series: Segments of data that are visualized separately in the chart
Category: Set of series organized together
Axes: Lines that define the chart's area and scale

Formatting a chart

The right formatting helps highlight key points in your presentation. Show enables you to customize the chart's style, layout, colors, borders, and much more. This makes your chart visually appealing and easy to understand at a glance, so you can communicate clearly with your audience. 

Learn more about formatting charts with Show's Web, Android, and iOS apps.


                            Zoho Desk Resources

                            • Desk Community Learning Series


                            • Digest


                            • Functions


                            • Meetups


                            • Kbase


                            • Resources


                            • Glossary


                            • Desk Marketplace


                            • MVP Corner


                            • Word of the Day


                                Zoho Marketing Automation


                                        Manage your brands on social media


                                              Zoho TeamInbox Resources

                                                Zoho DataPrep Resources


                                                  Zoho CRM Plus Resources

                                                    Zoho Books Resources


                                                      Zoho Subscriptions Resources

                                                        Zoho Projects Resources


                                                          Zoho Sprints Resources


                                                            Qntrl Resources


                                                              Zoho Creator Resources


                                                                Zoho WorkDrive Resources


                                                                  Zoho Campaigns Resources

                                                                    Zoho CRM Resources

                                                                    • CRM Community Learning Series

                                                                      CRM Community Learning Series


                                                                    • Tips

                                                                      Tips

                                                                    • Functions

                                                                      Functions

                                                                    • Meetups

                                                                      Meetups

                                                                    • Kbase

                                                                      Kbase

                                                                    • Resources

                                                                      Resources

                                                                    • Digest

                                                                      Digest

                                                                    • CRM Marketplace

                                                                      CRM Marketplace

                                                                    • MVP Corner

                                                                      MVP Corner


                                                                        Design. Discuss. Deliver.

                                                                        Create visually engaging stories with Zoho Show.

                                                                        Get Started Now