Solution of the Week: Financial Reports with Impactful Visuals
Finance reporting is a critical part of understanding an organization’s financial health. With Zoho Analytics, you can easily create dynamic reports such as Balance Sheets, Budget Statements, and Profit and Loss Statements.
Now, with the release of Zoho Analytics 6.0, the platform offers even more advanced tools to optimize the financial report view. While Zoho Analytics has always enabled comprehensive financial reporting (through its integration connectors for Zoho Books, QuickBooks, Xero), the latest version enhances this with powerful visual features like Data Bars, which provide clearer insights into performance trends.
This document outlines how these reports can be generated using simple drag-and-drop functionality and customizable features in Zoho Analytics.
Creating a Balance Sheet Using Finance Data
Generating a Balance Sheet in pivot using Zoho Analytics allows you to visualize your organization’s financial position in a comprehensive and structured way.
- Drag and Drop the Data: Start by selecting the Balance sheet base type, Account group, Balance Sheet Account Type, and Balance Sheet Account Name from the Accounts table and drop them into the Rows shelf. Drag and drop the Credit Amount, Debit Amount, and Balance Sheet Total from the Accrual Transactions table into the Data shelf.
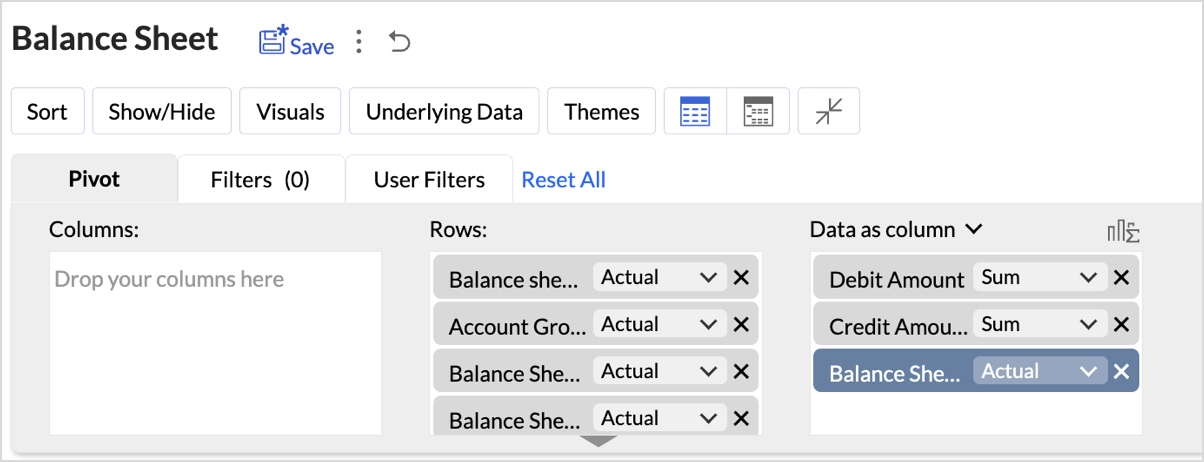
- Layout Adjustments:
- Navigate to Settings > Layout.

- Change the Layout to Compact.
- Check Increase Font Size for each higher group in Rows.
- Uncheck Show row numbers.
- Uncheck Show vertical lines between them.
- Set Column Width to Fit to Screen.
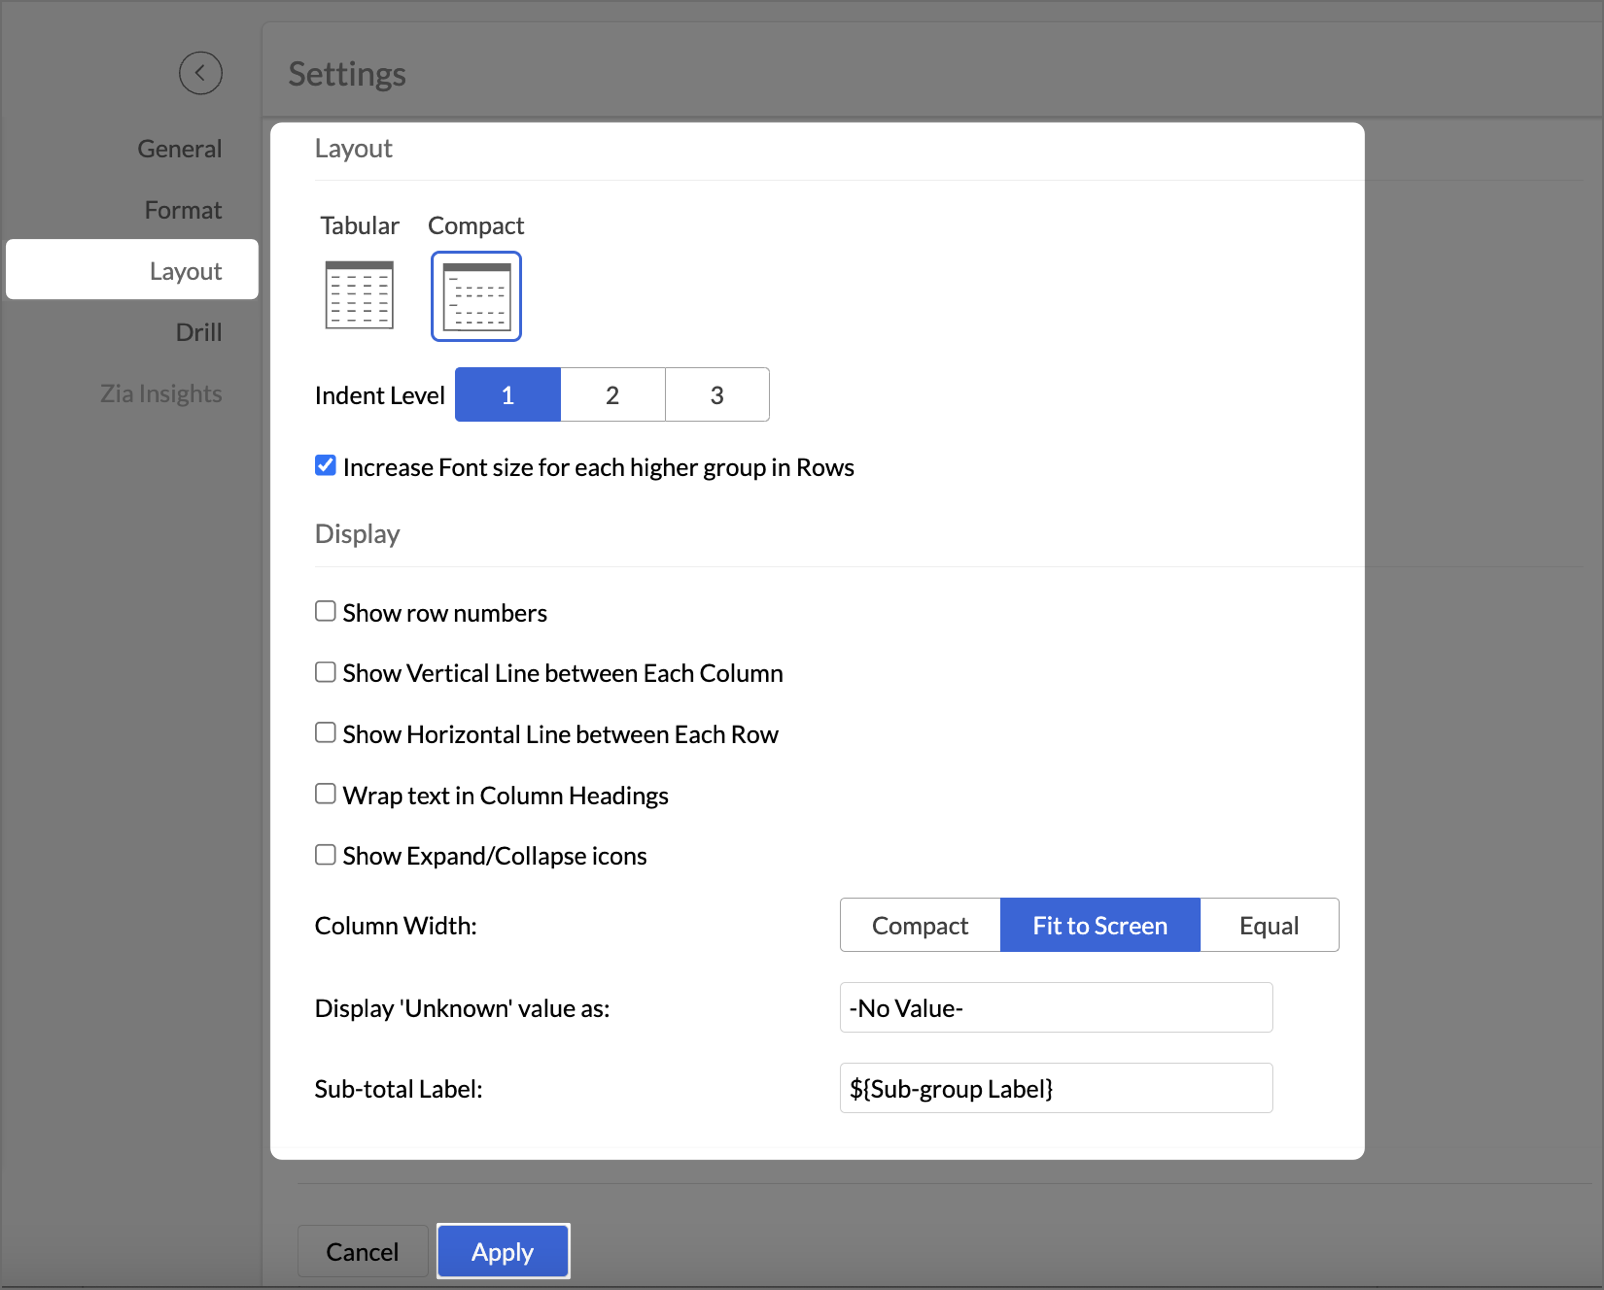
- After making layout adjustments, click Apply to finalize the formatting.
- Go to Visuals and select Data Bars With Data to improve the presentation of financial data, making it easier to interpret key insights visually.

By following these steps, you will generate a clear and structured Balance Sheet that highlights your organization's assets, liabilities, and equity.
Key Features of the Balance Sheet Report
- Increased Font Size for Key Categories
Emphasizes important financial categories like Assets, Equity, and Liabilities, improving readability and focus. - Compact Layout
Ensures a clear, organized display of financial data, enabling efficient consumption of the report. - Line Removal for Clean Aesthetics
Removal of vertical and horizontal lines results in a cleaner visual presentation, improving the user experience. - Data Bars for Quick Insights
Visual data bars provide a quick snapshot of financial status, allowing users to identify key trends at a glance. - Timeline Filter for Flexibility
Filters allow users to view financial data across different periods, making it easier to analyze financial trends over time.
In Zoho Analytics, utilizing the Timeline Filter allows users to transform static financial data into a time-based, dynamic report. The formulas used in creating this filter enable detailed insights into financial performance over a selected period. Below, we explain the key aggregate formulas and how they enable users to achieve greater flexibility and customization, going beyond the typical app potential.
- Opening Balance Formulasum_if("Accrual Transactions"."Transaction Date" < ${system.timeline.date.from},if("Accounts"."Account Base Type" in ('Asset') OR ("Accounts"."Account Base Type" in ('Equity') and "Accounts"."Account Name" in ('Drawings')),"Accrual Transactions"."Debit - Credit","Accrual Transactions"."Credit - Debit"),0)
This formula calculates the Opening Balance for a selected period by summing transactions that occurred before the specified date (timeline.date.from).
This approach allows users to view the Opening Balance as of a given date, making it highly flexible for periods that differ across user's datasets.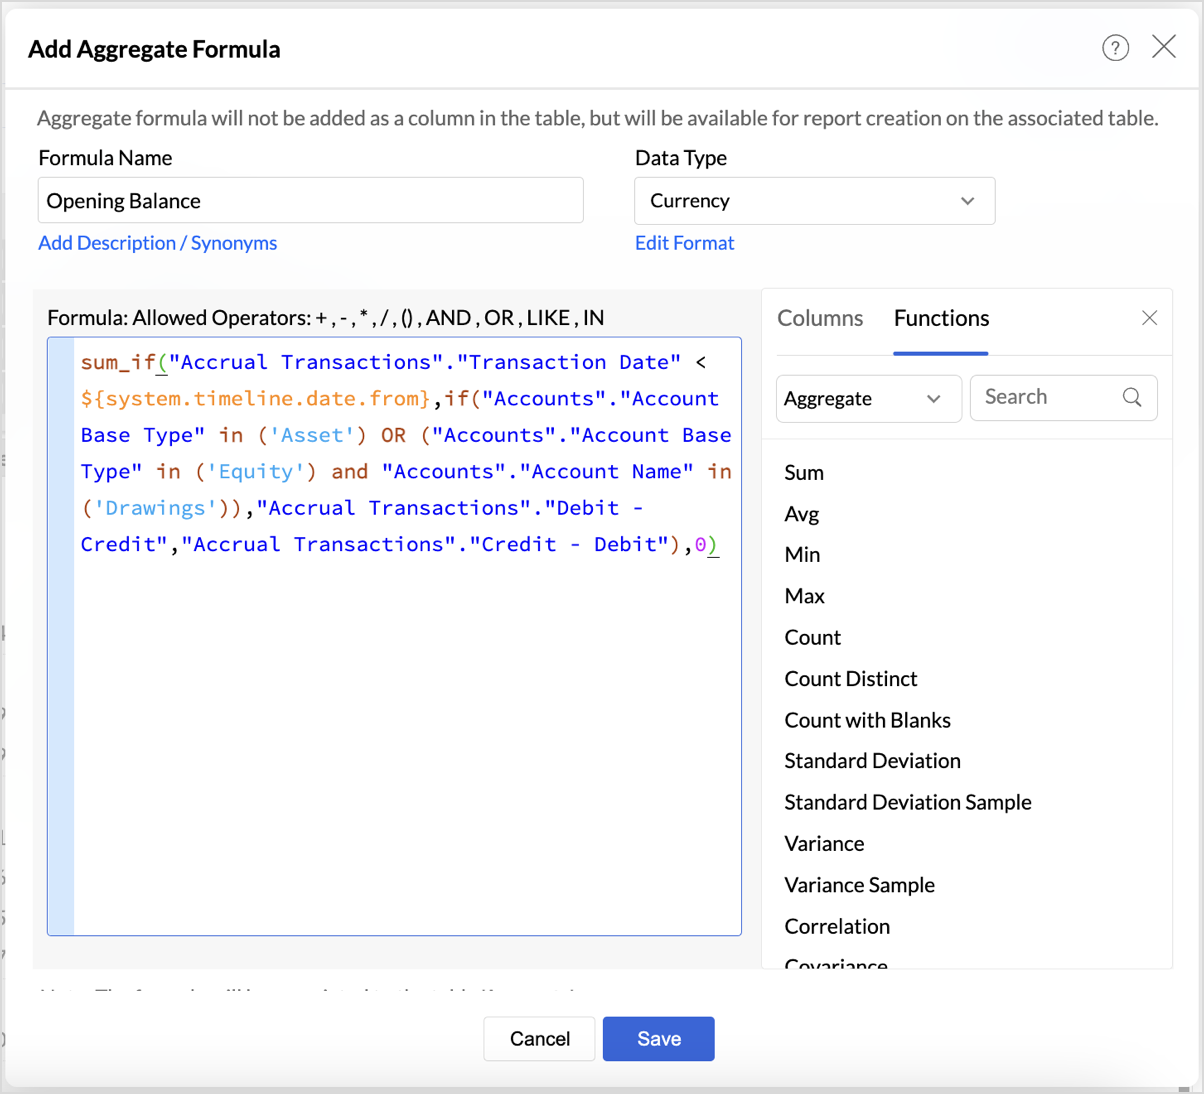
|
if("Accounts"."Account Base Type" in ('Asset') OR ("Accounts"."Account Base Type" in ('Equity') and "Accounts"."Account Name" in ('Drawings')),"Accrual Transactions"."Debit - Credit","Accrual Transactions"."Credit - Debit")
|
- Period Balance Formulasum_if("Accrual Transactions"."Transaction Date" > ${system.timeline.date.from} and "Accrual Transactions"."Transaction Date" <= ${system.timeline.date.to},if("Accounts"."Account Base Type" in ('Asset') OR ("Accounts"."Account Base Type" in ('Equity') and "Accounts"."Account Name" in ('Drawings')),"Accrual Transactions"."Debit - Credit","Accrual Transactions"."Credit - Debit"),0)
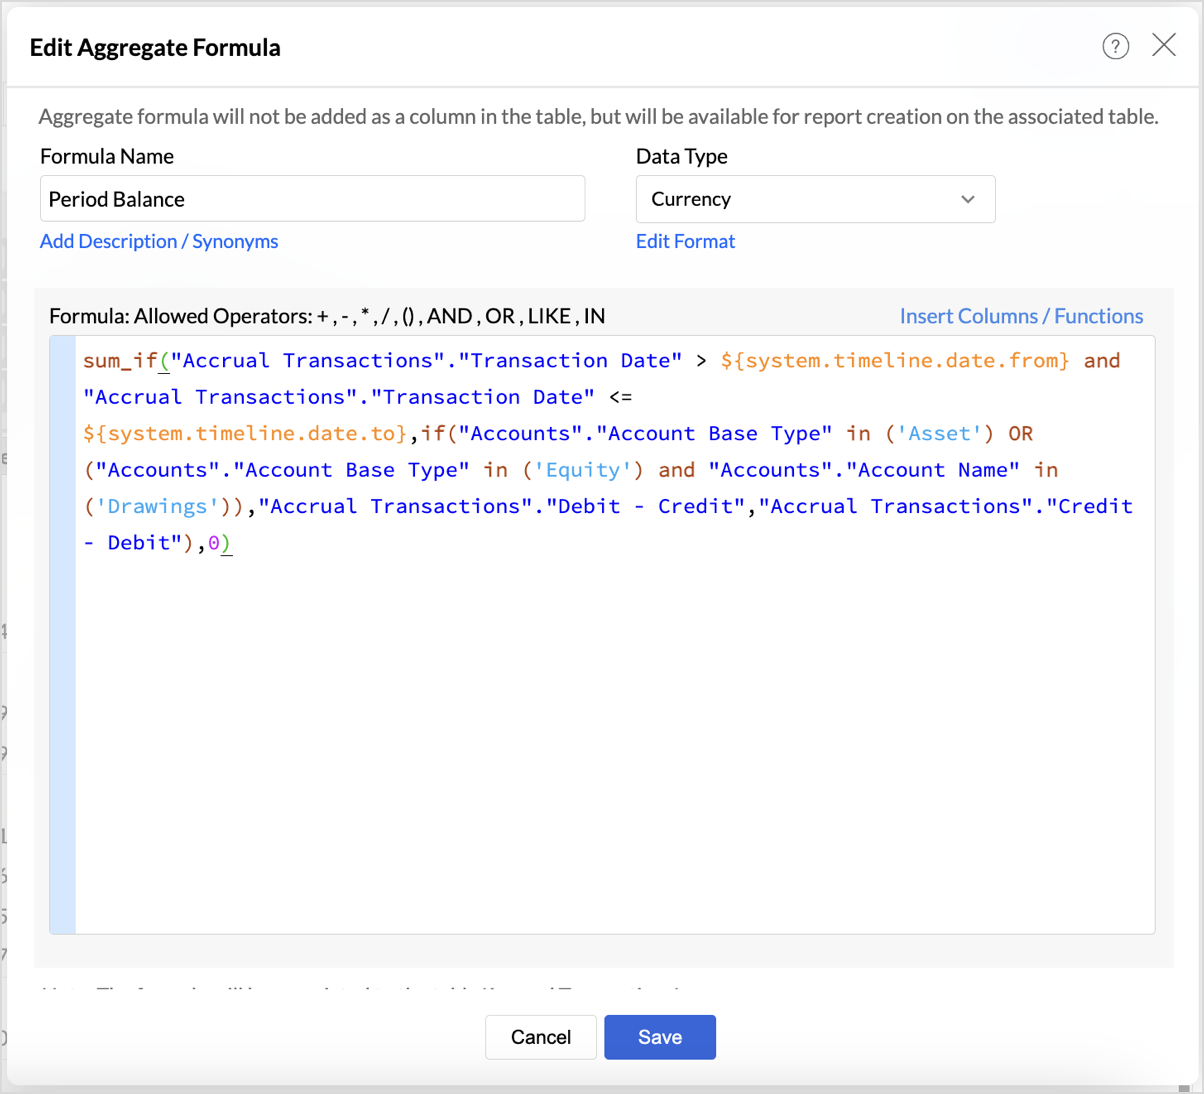
- Closing Balancesum_if("Accrual Transactions"."Transaction Date" <= ${system.timeline.date.to},if("Accounts"."Account Base Type" in ('Asset') OR ("Accounts"."Account Base Type" in ('Equity') and "Accounts"."Account Name" in ('Drawings')),"Accrual Transactions"."Debit - Credit","Accrual Transactions"."Credit - Debit"),0)
The Closing Balance formula calculates the final balance as of a selected date (timeline.date.to). It works by summing all transactions up until the specified date, following the same account type distinctions used in the previous formulas.
This formula is essential for determining the financial standing of an organization at the end of a reporting period, such as the end of a quarter or year.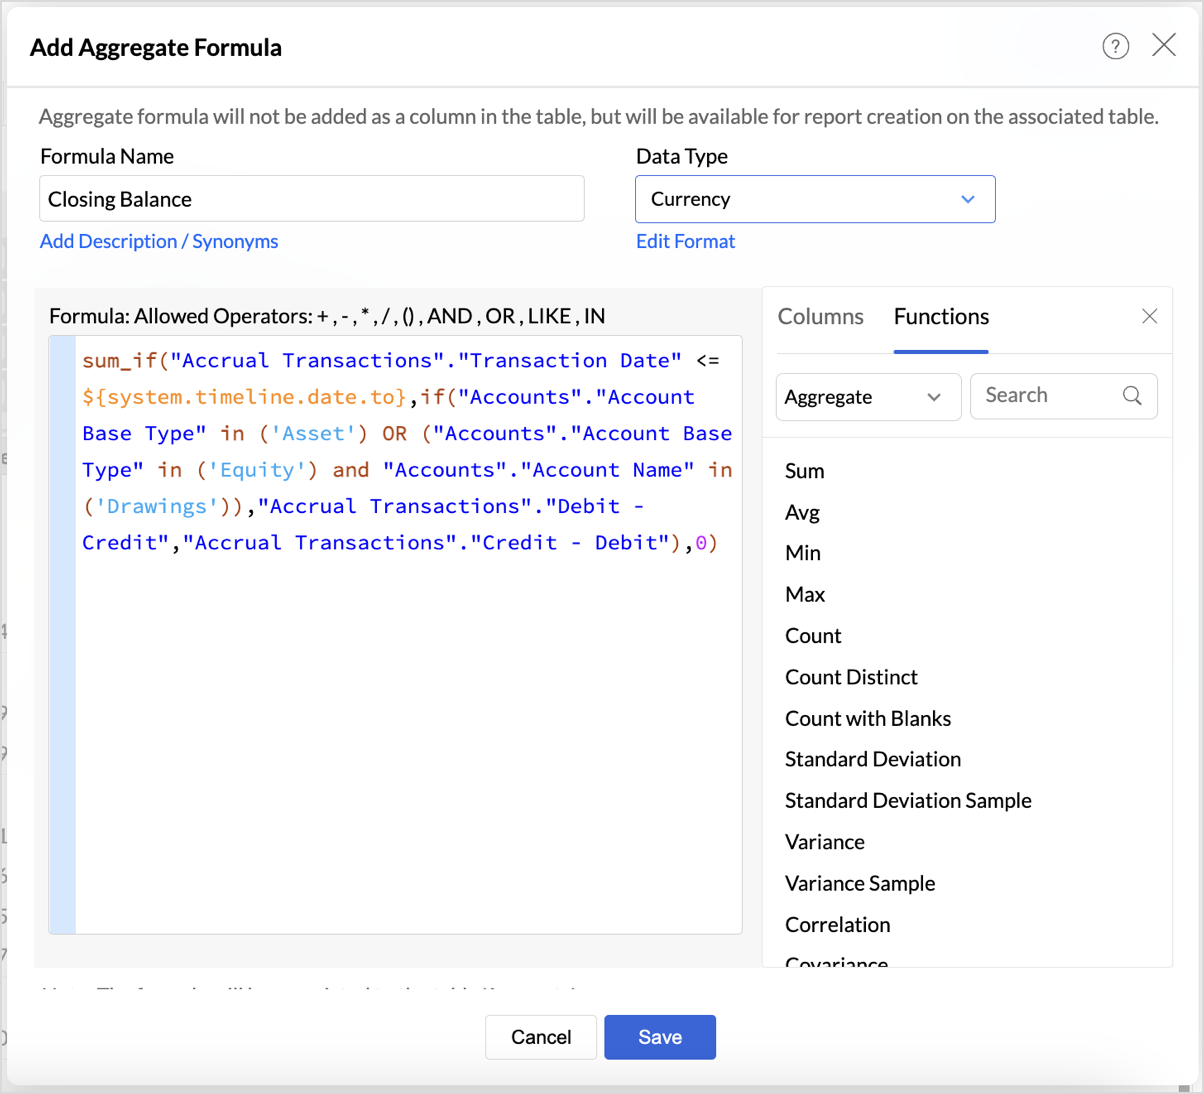
Follow the below steps to create opening and closing balances with timeline filters:
- Drag and drop the created aggregate formulas into the data shelf.
- Select Data as row from the drop-down.
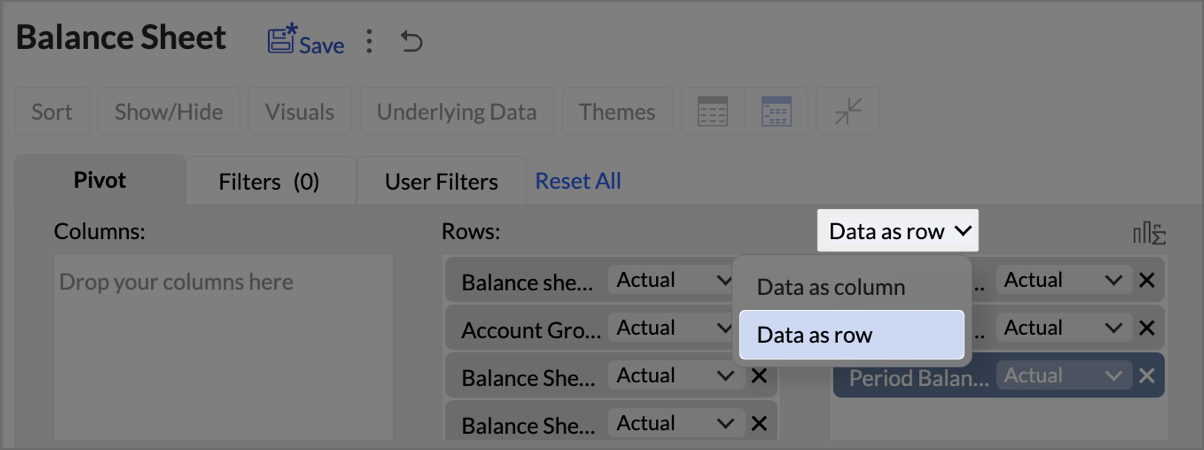
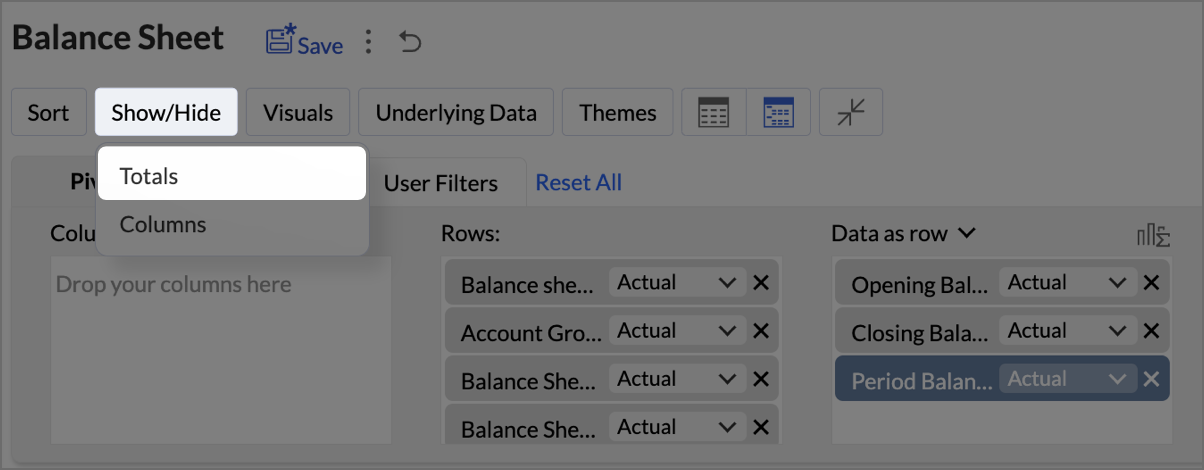
- Click on Show/Hide, then select Totals.
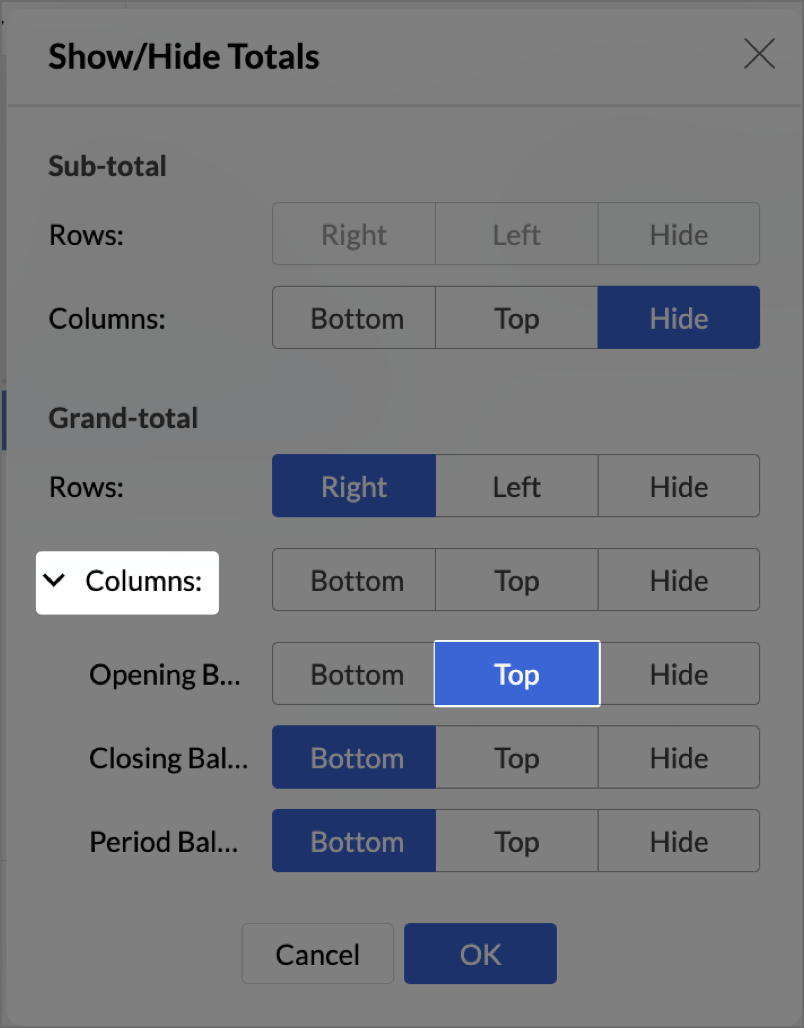
- Click on Columns drop-down, then set the Opening Balance as Top.
- Navigate to Settings > Layout and set Column Width as Equal. Provide Width value as required in px.
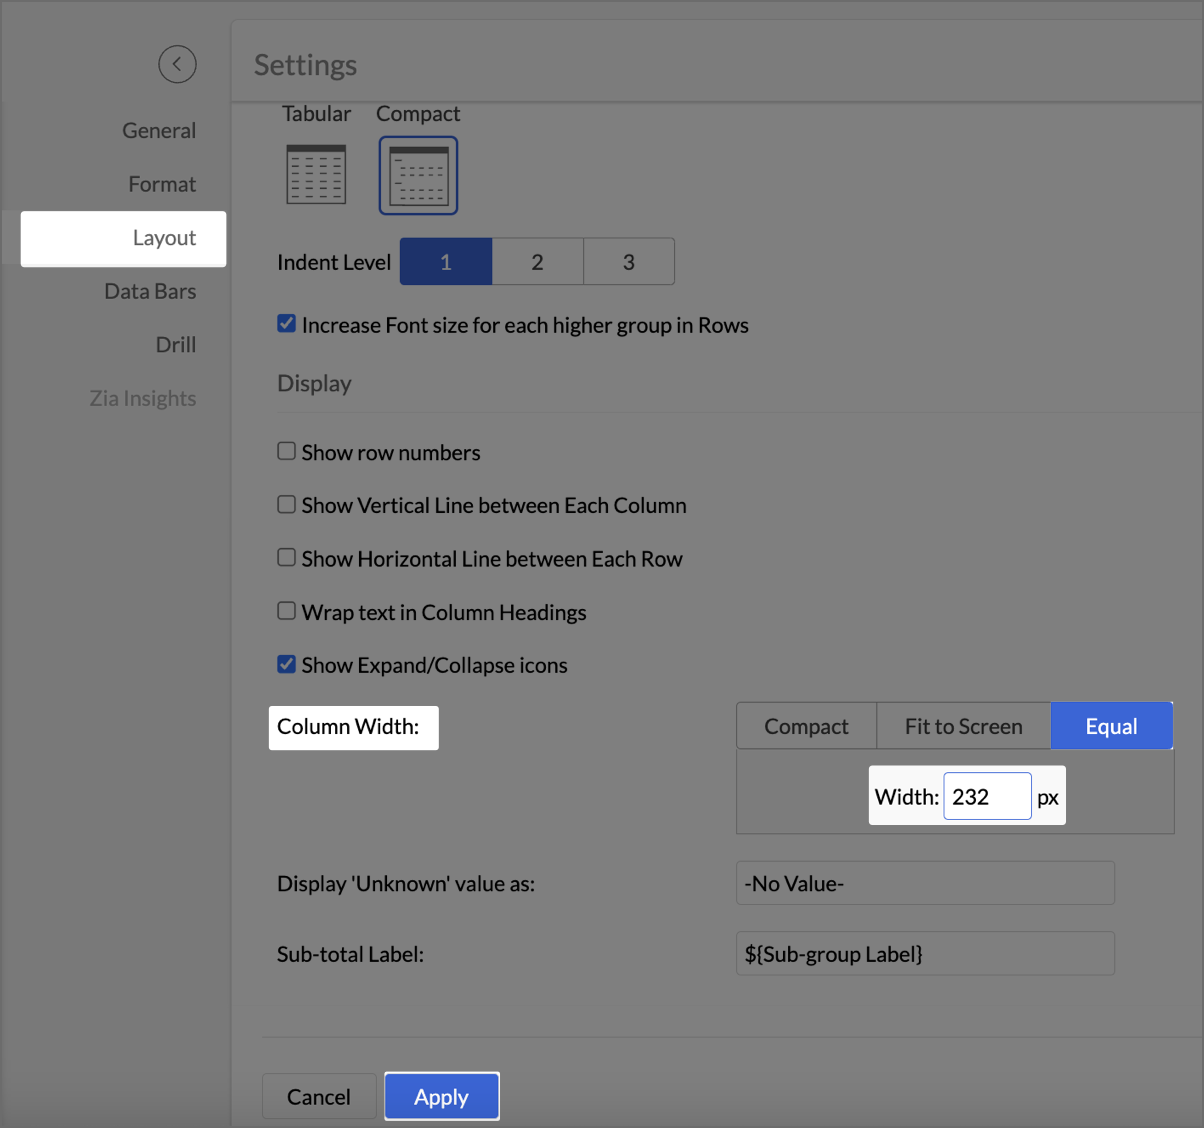
- Click Apply.
- Check Include Timeline Filter.
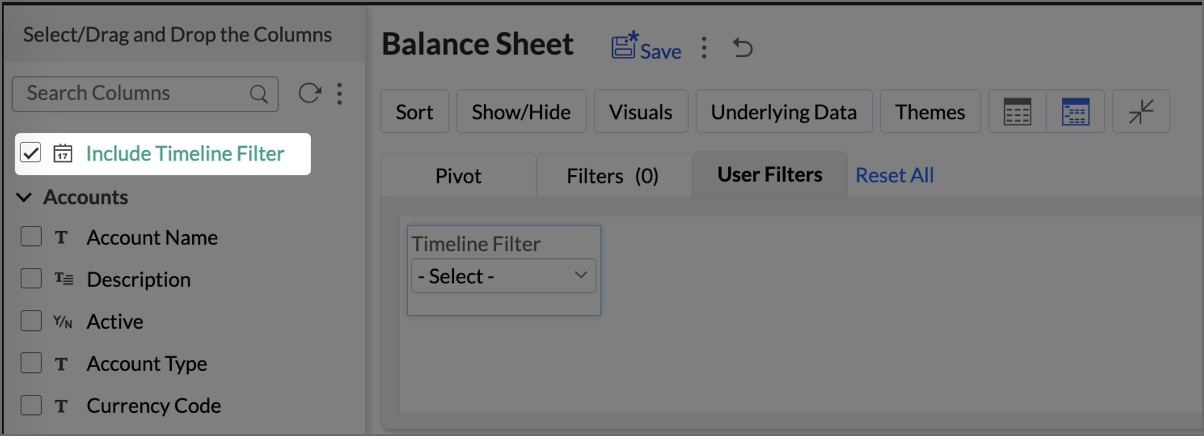
The Timeline Filter is now enabled, and users can apply time-based filters to their data.
Creating a Budget Statement
A Budget Statement helps compare actual financial performance against projected budgets, identifying variances and areas of concern. This visually enhanced report is designed to help businesses quickly assess deviations between expected and real expenditures, allowing for better budget management and financial decision-making.
- Drag and drop Account into the Row shelf, and Actuals and Budget into the Data shelf from the Budget vs Actual table.

- Add Report Formula:
- Click Add Report Formula to create custom calculations.
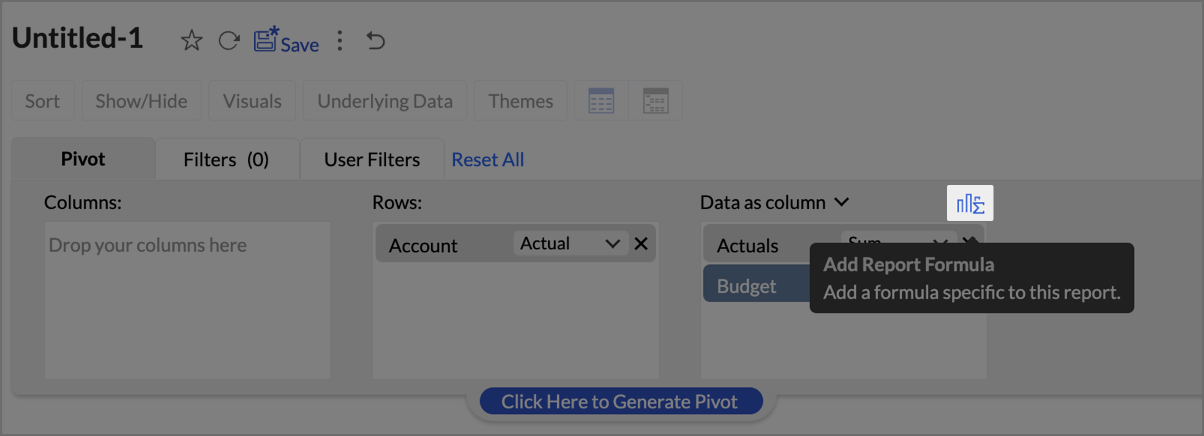
- Name the formula column appropriately (e.g., “Deviation”).
- Set Data Type as Decimal Number
- Create a formula to calculate the difference between actuals and budget as shown in the image.
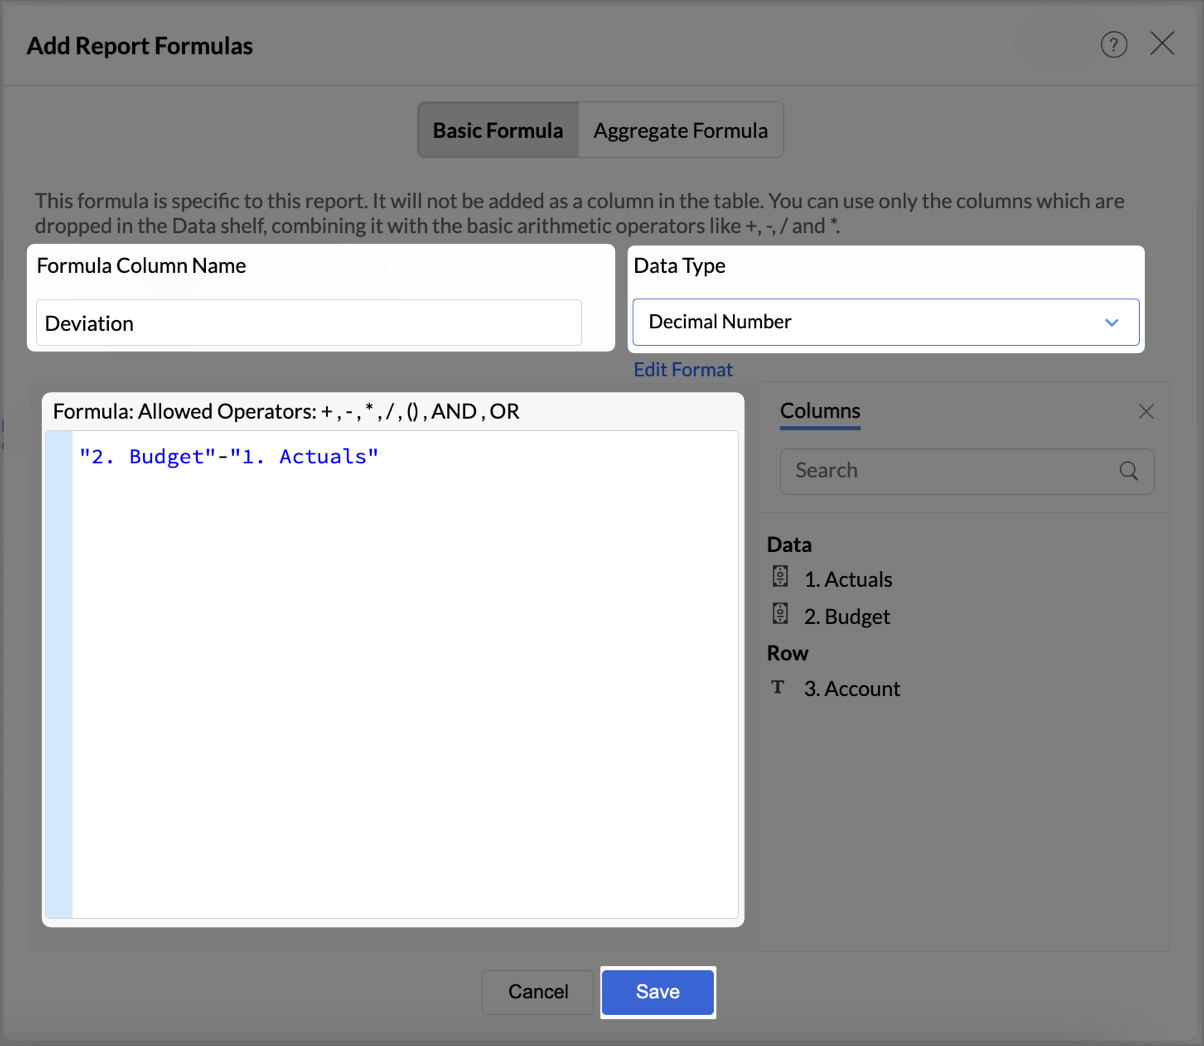
- Click Save.
- By following the same steps mentioned above, create one more formula to calculate the percentage difference between actuals and budget as shown in the image.
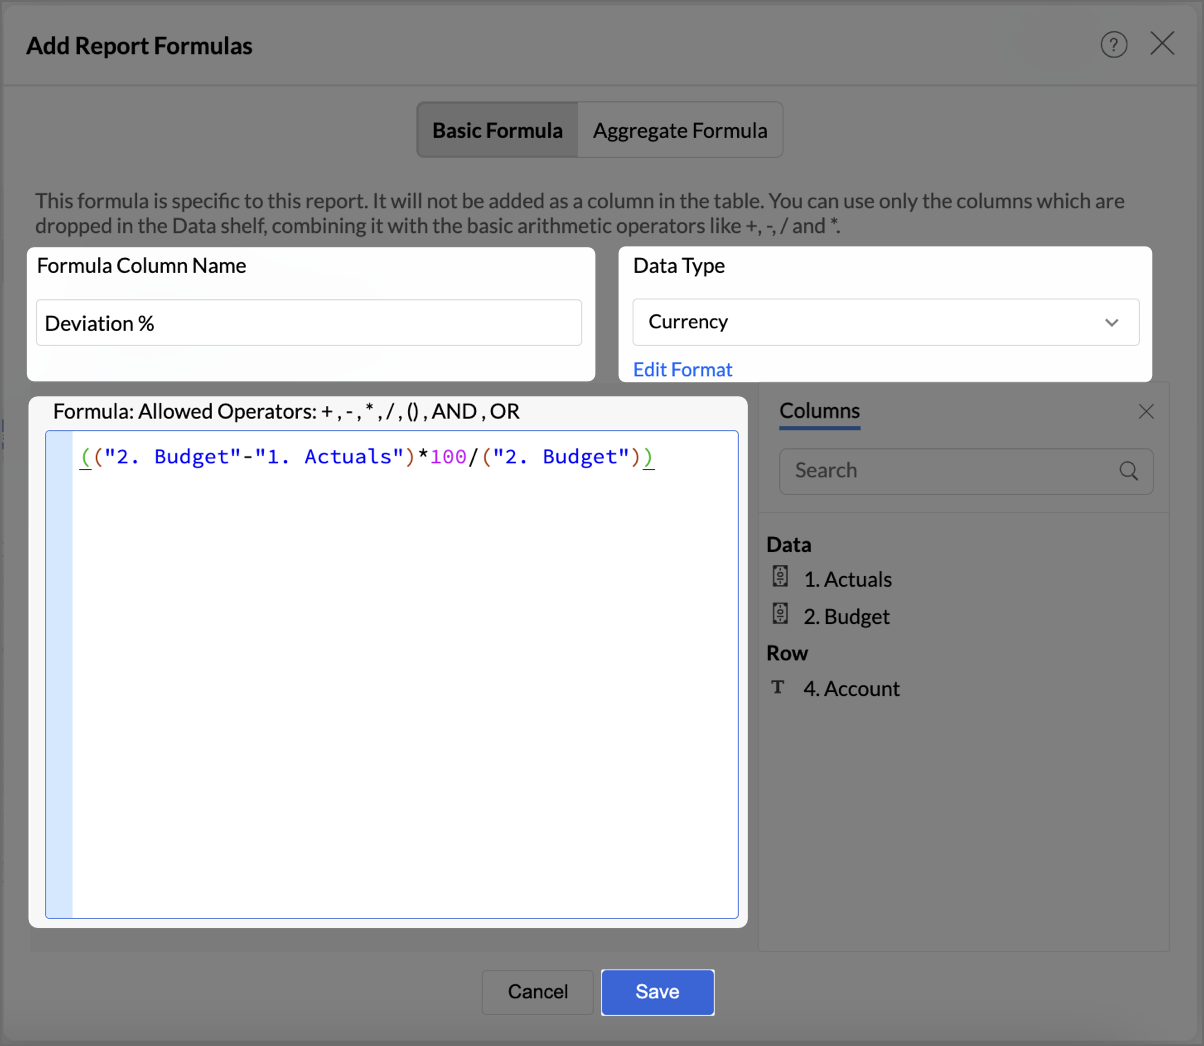
- Click Save.
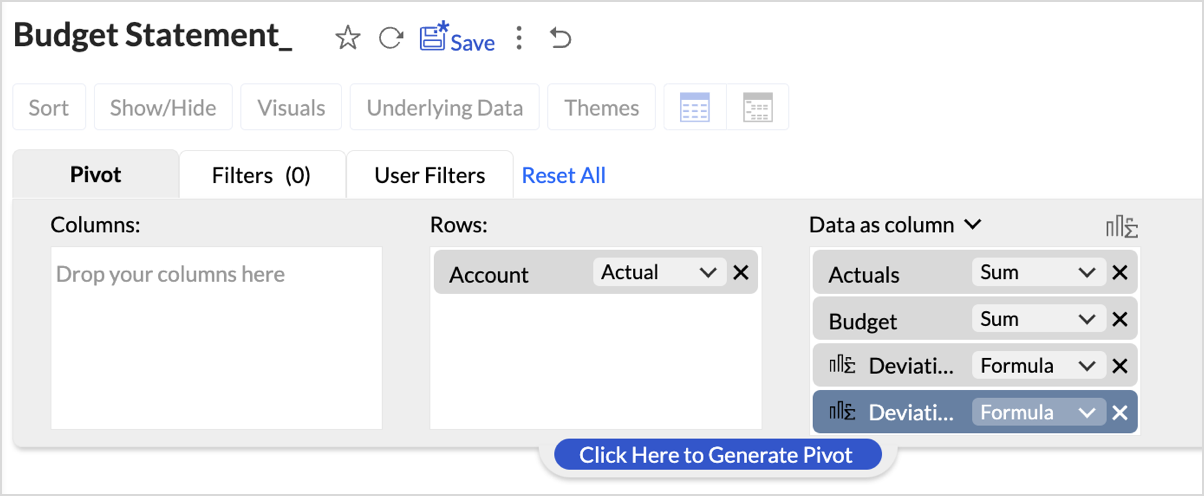
The created formulas will appear in your data shelf and columns, reflecting in the report. - Go to Visuals and choose Data Bars With Data for a more intuitive understanding of budget performance.
By following these steps, you will have a detailed Budget Statement that compares actual spending to the budget, highlighting deviations.
Report Structure and Visuals
- Account Breakdown
The report is organized by account categories, such as Bank Fees, Cost of Goods Sold, and more, showing both Budgeted and Actual amounts for each category. - Key Columns
The report includes the following key columns: - Total Budget - Displays the budget allocated for each account.
- Total Actuals - Shows the actual amount spent or earned for each account.
- Variance (Deviation) - Represents the difference between the budgeted amount and the actuals.
- Variance Percentage (Deviation %) - This column shows the percentage difference between the budgeted and actual amounts, highlighting under- or over-expenditure.
- Data Bars for Clarity
- Green Bars indicate favorable performance (within or under budget).
- Red Bars highlight overspending or budget deviations (e.g., Office Expenses or Rent).
Key Features of the Budget Statement Report
- Visual Representation of Deviations
Data bars visually indicate how spending aligns or deviates from the budget, enabling quick identification of problem areas. - Concise Overview of Financial Performance
The report provides a clear overview of actual versus budgeted performance, allowing decision-makers to assess financial health efficiently. - Enhanced Usability with Percent Deviations
Percentage-based deviation columns allow users to understand the scale of over- or under-performance relative to the budget, making it easy to identify areas that are significantly off track.
Creating Profit and Loss report
A Profit and Loss (P&L) report in Zoho Analytics helps businesses assess their revenue, expenses, and profitability over a specific period. By following these steps, you can create a detailed and visually engaging P&L report.
- Drag and drop Account base type, P&L Operating Profit Type, P&L Gross Type, Base type P&L, and Account Name into the Columns shelf from the Accounts table and Profit and Loss Balance into the Rows from Data shelf from the Accrual Transactions table.

- Layout Adjustments:
- Navigate to Settings > Layout.

- Change the layout to Compact.
- Set Indent Level to 3.
- Check Increase Font Size for each higher group in Rows to make key categories more visible.
- Uncheck Show row numbers for a cleaner report.
- Uncheck Show Vertical Line between Each Column to streamline the visual presentation.
- Set Column Width to Equal and specify the width as required in px.
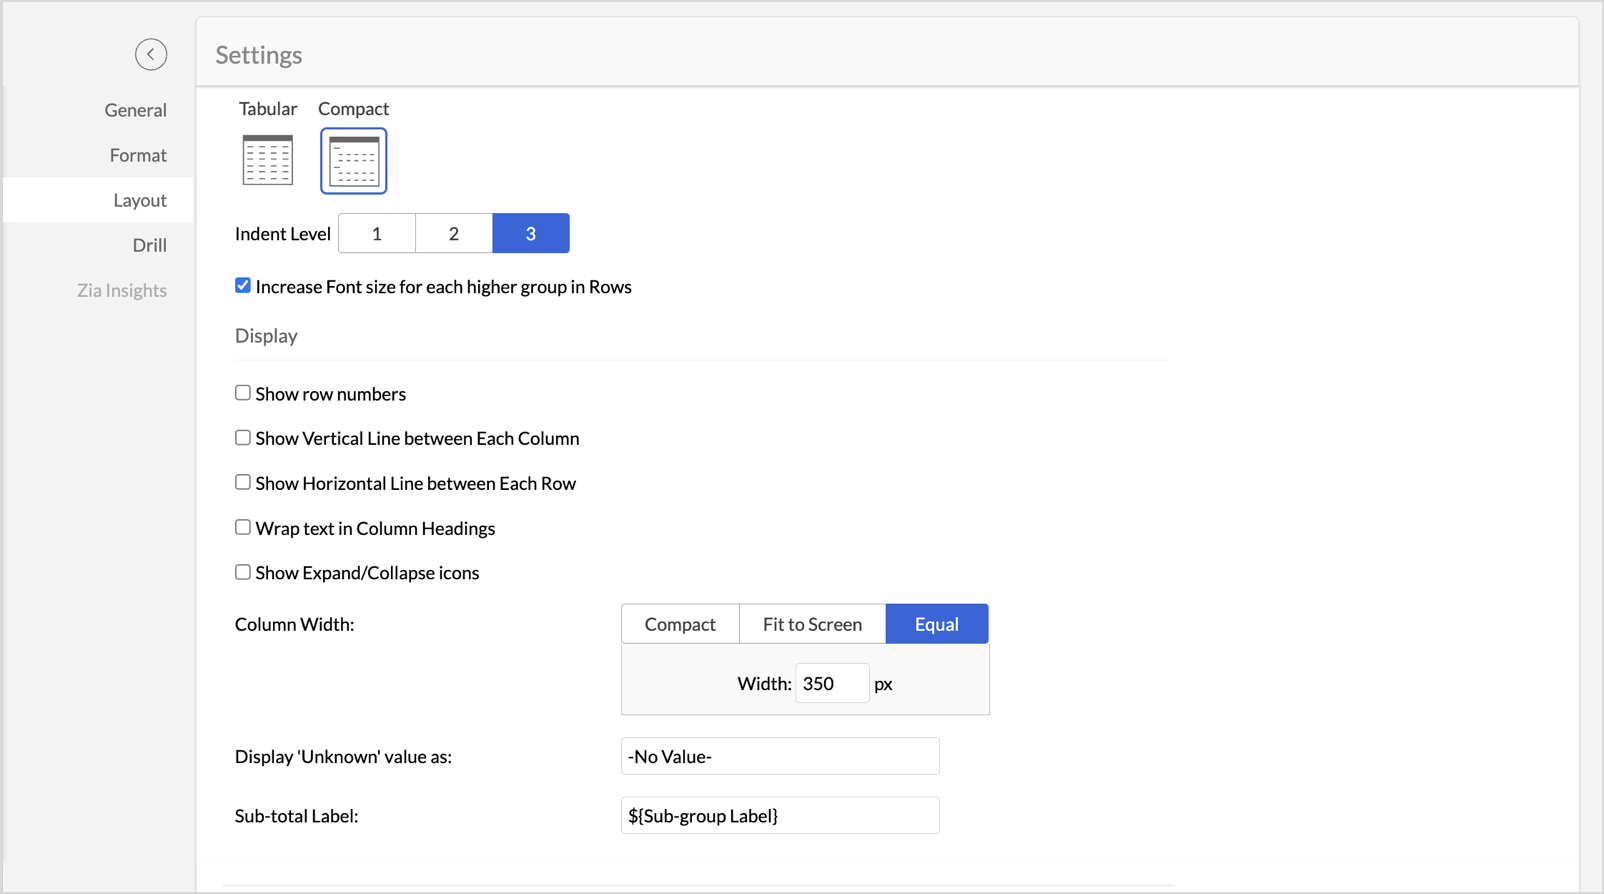
- Navigate to Settings > Layout.
- Once the layout adjustments are made, click Apply to lock in the formatting.
- Click Themes, and select the second theme. Set Row Spacing as 2.
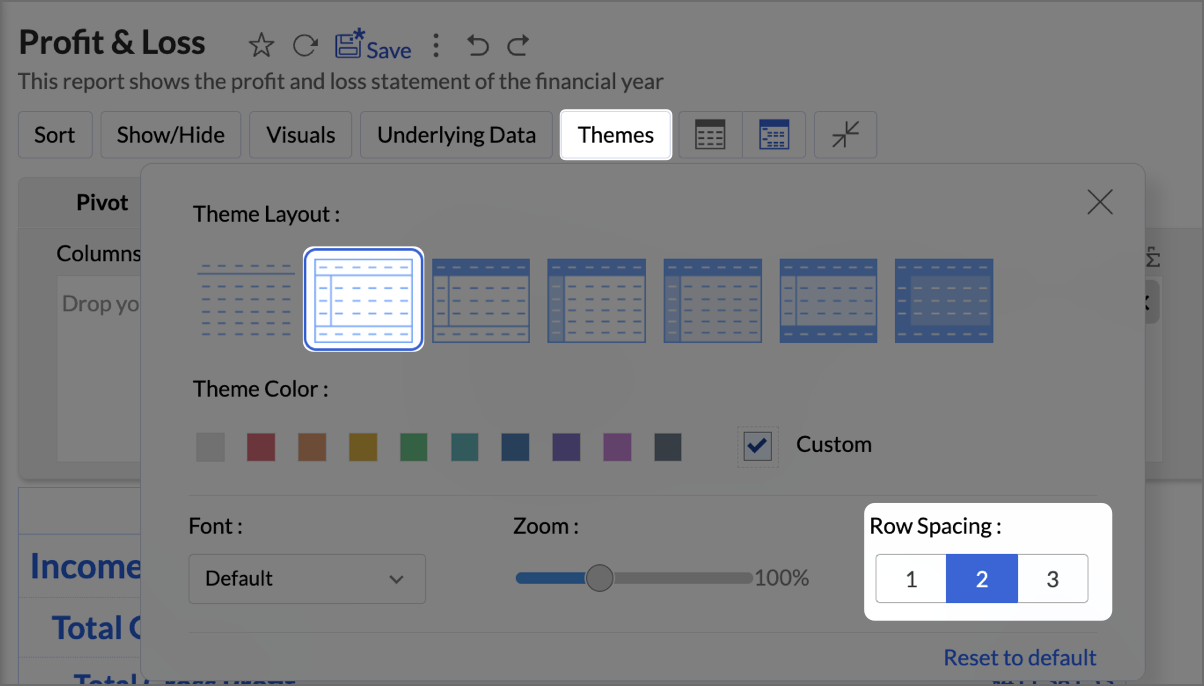
- Navigate to Visuals and select Data Bars With Data to provide a quick and clear visual representation.

By following the above steps, you will create aProfit and Loss report which provides a concise and structured view of your business’s financial performance, making it easy to track profitability over time and identify key financial trends.
Zoho Analytics provides an intuitive and customizable platform for generating comprehensive Balance Sheets, Budget Statements, and Profit & Loss reports. With its drag-and-drop functionality and powerful visual tools, Zoho Analytics transforms finance reporting into a data-driven process that improves decision-making, forecasting, and resource management.
Start leveraging Zoho Analytics today to create reports that provide actionable insights, helping your organization thrive financially!
All-in-one knowledge management and training platform for your employees and customers.
Zoho Developer Community
Topic Participants
Pradeepkumar R
Storytelling BeanCounter - www.storytellingbeancounter.com
Inform
Pradeepkumar R
Sticky Posts
Tip of the Week - Spot Risky Sales with Conditional Formatting
In Zoho Analytics, small tweaks can lead to big insights. One such feature is Conditional formatting based on other columns, your key to instantly spotting where sales success is overshadowed by product returns. Our tip this week shows you how to apply
Zoho TeamInbox Resources
Zoho CRM Plus Resources
Zoho Books Resources
Zoho Subscriptions Resources
Zoho Projects Resources
Zoho Sprints Resources
Qntrl Resources
Zoho Creator Resources
Zoho CRM Resources
Zoho Show Resources
Get Started. Write Away!
Writer is a powerful online word processor, designed for collaborative work.
-
オンラインヘルプ
-
Webセミナー
-
機能活用動画
-
よくある質問
-
Ebook
-
-
Zoho Campaigns
- Zoho サービスのWebセミナー
その他のサービス コンテンツ
Nederlandse Hulpbronnen
ご検討中の方
Recent Topics
Exported Report File Name
Hi, We often export reports for information. It is time consuming to rename all the reports we export on a weekly basis, as when exported their default name is a seemingly random string of numbers. These numbers may be important, I'm not sure, but I amAutomatic Refresh on Page?
Hi everyone, We use a page as a dashboard which shows data for the laboratory and tasks pending etc. Is there a way to set the page to automatically refresh on a X time? Many thanks TOGFull Context of Zoho CRM Records for Zia in Zoho Desk for efficient AI Usage
Hello everyone, I have a question regarding the use of Zia in Zoho Desk in combination with CRM data. Is it possible to automatically feed the complete context of a CRM record into Zia, so that it can generate automated and highly accurate responses forHiding Pre-defined Views
You can enhance Zoho with custom views - but you cannot hide the pre-defined views. Most users focus on 4 or 5 views. Right now for EVERY user EVERY time they want to move to one of their 4 or 5 views - they have to scroll down past a long list of pre-defined views - we don't use ANY of the pre-defined views. Adding the feature to allow a predefined view to be hidden completely or only visible to certain users would be a big improvement in usability for Zoho CRM. This feature is already available[Webinar] Top 10 Most Used Zoho Analytics Features in 2025
Zoho Analytics has evolved significantly over the past year. Discover the most widely adopted features in Zoho Analytics in 2025, based on real customer usage patterns, best practices, and high-impact use cases. Learn how leading teams are turning dataHow do I edit the Calendar Invite notifications for Interviews in Recruit?
I'm setting up the Zoho Recruit Interview Calendar system but there's some notifications I don't have any control over. I've turned off all Workflows and Automations related to the Calendar Scheduling and it seems that it's the notification that is sentAdd RTL and Hebrew Support for Candidate Portal (and Other Zoho Recruit Portals)
Dear Zoho Recruit Team, I hope you're doing well. We would like to request the ability to set the Candidate Portal to be Right-to-Left (RTL) and in Hebrew, similar to the existing functionality for the Career Site. Currently, when we set the Career SiteApp for Mac OS X please!
It would be awesome to have a mail app for Mac OS X that included all the cool features such as steams, calendar, tasks, contacts, etc. Most people prefer native apps, rather than running it through a web browser. I know that we can use the IMAP, CalDAV,How to integrate Zoho CRM, Zoho Forms and a WIX Web Site
Attached video demonstrates how to use Zoho Forms included in Zoho One, to design a Contact Us form to be embedded into a WIX web site and integrated into Zoho CRM.CRM x WorkDrive: File storage for new CRM signups is now powered by WorkDrive
Availability Editions: All DCs: All Release plan: Released for new signups in all DCs. It will be enabled for existing users in a phased manner in the upcoming months. Help documentation: Documents in Zoho CRM Manage folders in Documents tab Manage filesIntroducing Workqueue: your all-in-one view to manage daily work
Hello all, We’re excited to introduce a major productivity boost to your CRM experience: Workqueue, a dynamic, all-in-one workspace that brings every important sales activity, approval, and follow-up right to your fingertips. What is Workqueue? SalesDefault Reminder Time in New Tasks or New Event?
Any way to change this from 1:00am? Thanks, Gary Moderation Update (February 2026): With the Calendar preferences, the default reminder time for Meetings, Appointments and All-Day Meetings can be set. Read more: Calendar preferences in Zoho CRM RegardingExporting All Custom Functions in ZohoCRM
Hello, All I've been looking for a way to keep about 30 functions that I have written in Zoho CRM updated in my own repository to use elsewhere in other instances. A github integration would be great, but a way to export all custom functions or any wayDynamic Field Folders in OneDrive
Hi, With the 2 options today we have either a Dynamic Parent Folder and lots of attachments all in that one folder with only the ability to set the file name (Which is also not incremented so if I upload 5 photos to one field they are all named the sameRight Shift key not sending to Zoho Assist environments
I'm unable to use Right Shift key in Zoho environments. Zoho environments are Win10. Computer I access from is Win 11. Issue started when I changed to Win 11. Have tried: - Multiple browsers - web client AND desktop client - 3rd party mapping tools toUnable to Filter Retail Sales Orders & Need Paid/Unpaid Filter – Zoho Books
Hi Zoho Team, Recently you introduced Retail – Standard and Retail – Premium templates for Sales Orders. However, in the Sales Order module we still cannot filter or segregate Retail Sales Orders separately from normal B2B sales orders. Because of this,About Meetings (Events module)
I was working on an automation to cancel appointments in zoho flow , and in our case, we're using the Meetings module (which is called Events in API terms). But while working with it, I'm wondering what information I can display in the image where theHow can I hide "My Requests" and "Marketplace" icon from the side menu
Hello everybody, We recently started using the new Zoho CRM for Everyone. How can I hide "My Requests" and "Marketplace" from the side menu? We don't use these features at the moment, and I couldn't find a way to disable or remove them. Best regards,PDF Annotation is here - Mark Up PDFs Your Way!
Reviewing PDFs just got a whole lot easier. You can now annotate PDFs directly in Zoho Notebook. Highlight important sections, add text, insert images, apply watermarks, and mark up documents in detail without leaving your notes. No app switching. NoAbility to assign Invoice Ownership through Deluge in FSM
Hi, As part of our process, when a service appointment is completed, we automated the creation of the invoice based on a specific business logic using Deluge. When we do that, the "Owner" of the invoice in Zoho FSM is defaulted to the SuperAdmin. ThisHow do you do ticket add ons in Backstage?
Hi Everyone, If you wanted to have general admin tickets and allow for add ons, like camping, or car or Carbon offset. What would you do? Peace RobinFrom Zoho CRM to Paper : Design & Print Data Directly using Canvas Print View
Hello Everyone, We are excited to announce a new addition to your Canvas in Zoho CRM - Print View. Canvas print view helps you transform your custom CRM layouts into print-ready documents, so you can bring your digital data to the physical world withvalidation rules doesn't work in Blueprint when it is validated using function?
I have tried to create a validation rule in the deal module. it works if I try to create a deal manually or if I try to update the empty field inside a deal. but when I try to update the field via the blueprint mandatory field, it seems the validationPull cells from one sheet onto another
Hello all! I have created an ingredients database where i have pricing and information and i want to pull from that database into a recipe calculator. I want it to pull based on what ingredient I choose. The ingredients database has an idea and i wantHow can Data Enrichment be automatically triggered when a new Lead is created in Zoho CRM?
Hi, I have a pipeline where a Lead is created automatically through the Zoho API and I've been trying to look for a way to automatically apply Data Enrichment on this created lead. 1) I did not find any way to do this through the Zoho API; it seems likeEmails Failing with “Relaying Issues – Mail Sending Blocked” in ZeptoMail
Hello ZeptoMail Support Team, We are facing an email delivery issue in our ZeptoMail account where emails are failing with the status “Process failed” and the reason “Relaying issues – Mail sending blocked.” Issue Details Agent Name: mail_agent_iwwa FromHow does Zoho handle support operations for our EU users?
Dear Zoho users, We have some news and reminders about how we handle support operations for Zoho users in the EU Data Center. This is part of our broader commitment to ensuring GDPR compliance and providing secure data handling for all users. We'd likeSender Email Configuration Error.
Hello Team, Hope you are all doing well. We are in the process of creating the Zoho FSM environment in the UAE. When we try to add the sender email address “techsupportuae@stryker.com”, we receive the error message: “Error occurred while sending mailDifferent Task Layouts for Subtasks
I was wondering how it would be possible for a subtask to have a different task layout to the parent task.Layout Adjustment.
Hello Latha, Hope you are doing well. I wanted to check with you about adjusting the layout columns in the Service Report from the backend, as currently there is no capability for us to customize the layout from our end. Below is the output that I amLet us view and export the full price books data from CRM
I quote out of CRM, some of my clients have specialised pricing for specific products - therefore we use Price Books to manage these special prices. I can only see the breakdown of the products listed in the price book and the specialised pricing forAnyone in Australia using Zoho Books AND has their account with NAB?
Hi I have an account with both NAB and Suncorp. Suncorp transaction come in the next day however NAB transactions take 4-5 business days to appear. eg: A deposit made today in my Suncorp will be imported into Zoho tomorrow. A deposit made today to the NAB account will be imported maybe Saturday (Friday overnight). I have contacted both Zoho and NAB but noone seems to know why. I was just wondering if anyone else in Australia uses NAB and has this issue (or doesn't) maybe we could compare notes andZoho Often Lag
Desk Team, We've noticed that Desk, Creator & other apps seems to lag more these days. We often refresh multiple times.Offer already made- but I withdrew it
I made an offer letter, but made a mistake on it. I withdrew the offer but now I can't recreate the correct offer. Zoho keeps saying that "A same offer has already been made". I look in the "offers" and there are NO offers (this is the first time I'veImporting into the 'file upload' field
Can you import attachments into the file upload field. I would expect it to work the same way as attachments do, But can't seem to get it to work. Moderation Update: The option to import into File Upload and Image Upload fields has been supported. ReadLayout Rules Don't Apply To Blueprints
Hi Zoho the conditional layout rules for fields and making fields required don't work well with with Blueprints if those same fields are called DURING a Blueprint. Example. I have field A that is used in layout rule. If value of field A is "1" it is supposed to show and make required field B. If the value to field A is "2" it is supposed to show and make required field C. Now I have a Blueprint that says when last stage moves to "Closed," during the transition, the agent must fill out field A. NowWhy is the ability Customize Calls module so limited?
Why can't I add additional sections? why can't I add other field types than the very limited subset that zoho allows? Why can I only add fields to the outbound/inbound call sections and not to the Call Information section?Zoho Desk blank screen
opened a ticket from my email, zoho desk comes up blank, nothing loads. our receptionist also gets the same thing under her login on her computer. our sales rep also gets same thing on zoho desk at his home on a different computer. I tried clearing cache/history/cookies,Optimum CRM setup for new B2B business
Can some advise the most common way to setup Zoho CRM to handle sales for a B2B company? Specifically in how to handle inbound/outbound emails. I have spent hours researching online and can't seem to find an accepted approach, or even a tutorial. I havefilter on sheets mobile (iOS, iPadOS) does not work
I have this issue on every spreadsheet, whether imported or created natively in Zoho Sheets. I can use on desktop without issue: desktop screenshot on iOS the filter dropdowns are not there and there is no way to add them mobile iPadOS looks the sameNext Page


