Tip of the Week: Moving Calculation with Dynamic Window
Moving Calculations are ideal for analyzing data sets that fluctuate a lot. Be it stock prices, temperature, or daily sales trend, moving calculation allows you to identify the trend. It smoothens the noise of the random short-term fluctuations from your report.
In moving calculations, the value for each data point will be calculated over a specified time frame. For example, you are calculating a moving average over your stock price and have set the window as 10 days. Now your chart plots the 10days average stock price for each data point. Zoho Analytics supports moving calculations and also allows you to change the time frame in your report dynamically using Variables.
This week, let's see how to create moving calculations with dynamic window.
Supported Moving Calculations
Zoho Analytics supports the following window calculations .
- Window Sum
- Window Average
- Window Minimum
- Window Maximum
- Window Count
- Window STD
- Window Variance
Variables
Variables are placeholders that can be used as input, and can be changed on the fly. They enable dynamic input parameterization for various operations. With variables, you can set a dynamic window for your moving calculation.
To create a variable,
- From the Explorer page, click Settings .
- Open the Variables tab.
- Click the Create New Variable button.
- The Create New Variable dialog will open.
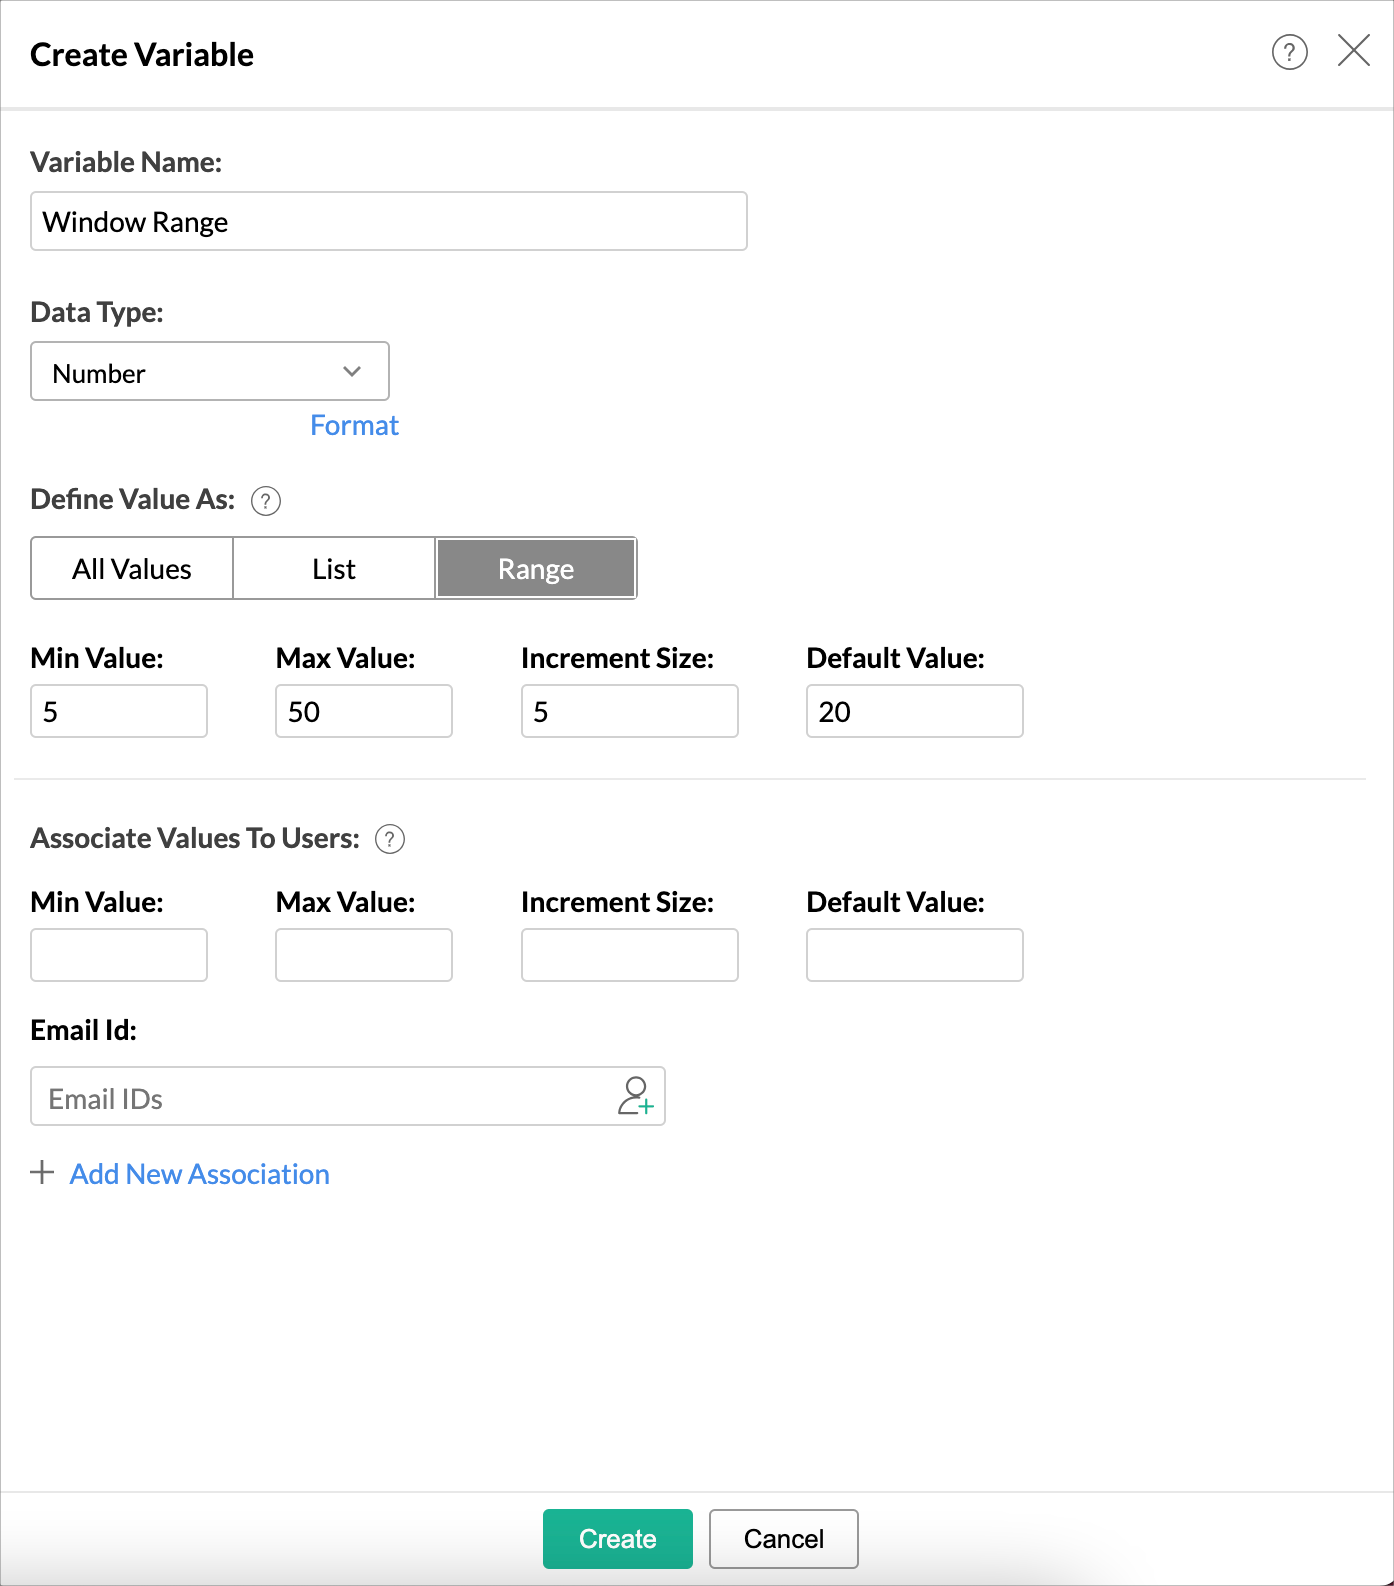
- Specify a name.
- Set the Data Typ e as Number .
- Select Range in the Define Value as field.
-
Specify a range. Here, we've set a range of 5 to 50 with 2 as the default value.

- Click Create .
The variable is created. Now, we can use this to input a dynamic window for the moving calculation.

Create a Moving Average with Dynamic Window
Follow the steps to create a chart with moving average with dynamic window.
- Calculate moving average with a dynamic window
- Create a moving average chart
Calculate Moving Average with a Dynamic Window
Now, let's see how to calculate a moving average with a dynamic window.
- Open the data table.
- Click the Add > Aggregate Formula.
-
The
Add Aggregate Formula
dialog will open.

-
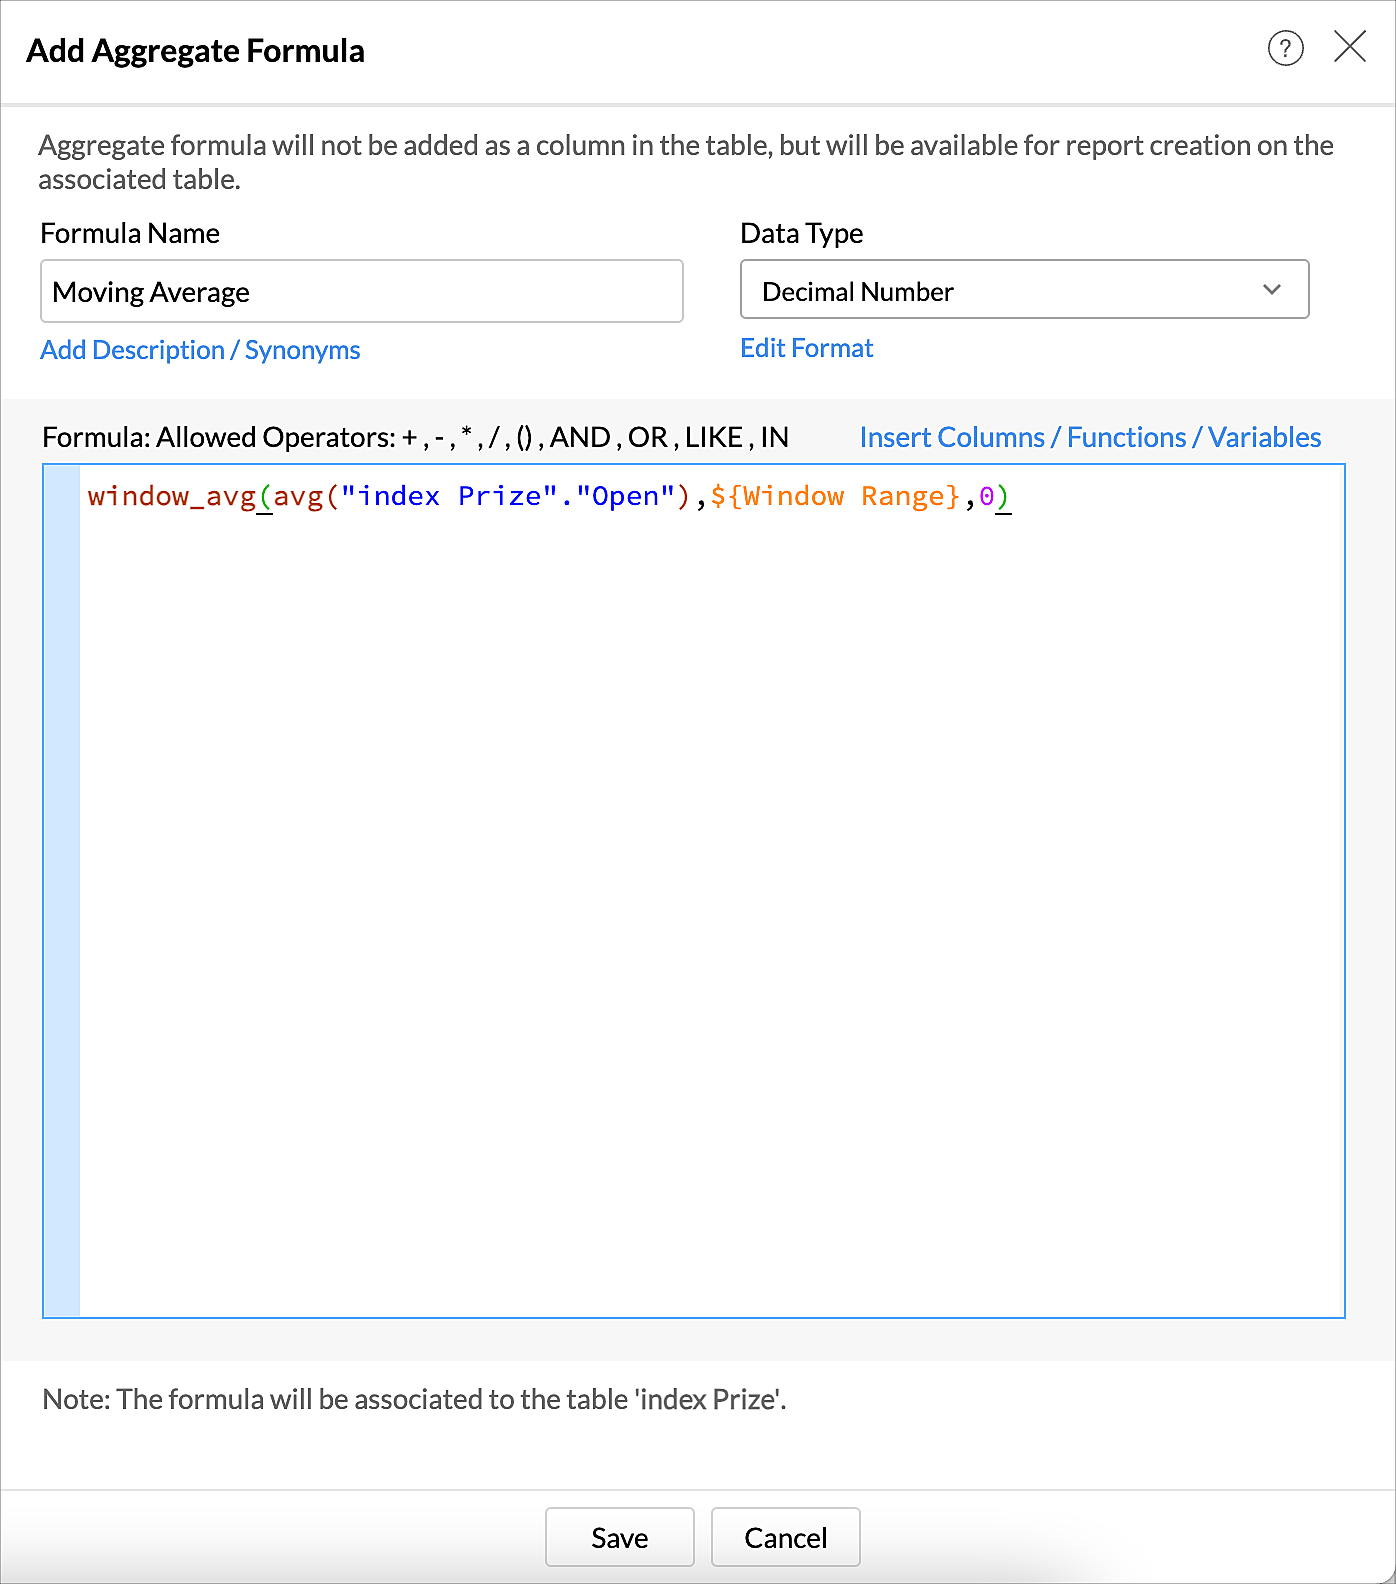
Specify the moving average formula with the variable as the window as in the following format.
window_function( Aggregate Expression, Start, End )
The following formula calculates the moving average of the stock price with a dynamic window.
window_avg(avg( "index Prize"."Open" ), ${Window Range} , 0 )
- Click Save .
The formula is created. Now it can be used in the report.
Create a Moving Average Chart
Now let's create the moving average chart.
- Click Create > Chart View.
- Add the Date column with Full Date in X-Axis.
-
Add the
Moving Average Aggregate Formula and Closed Prize
in
Y-Axis.

-
Add the
variable
as
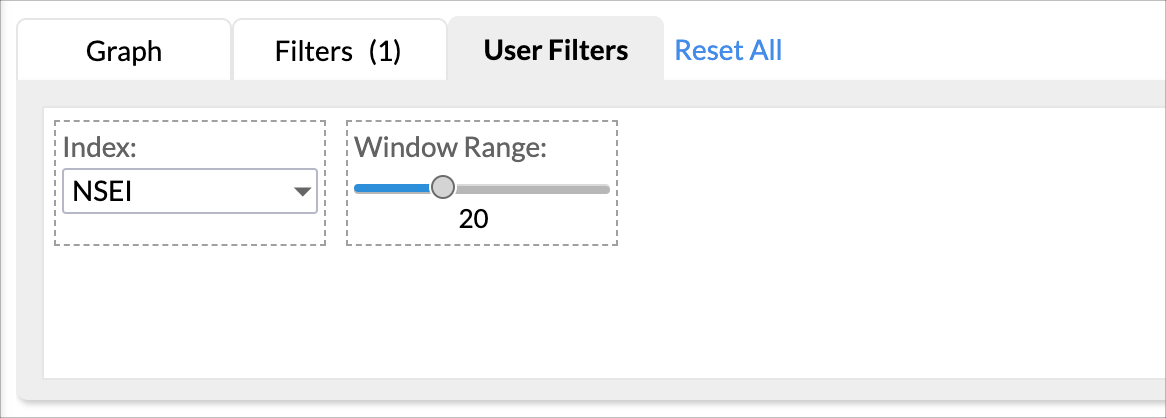
User Filter.

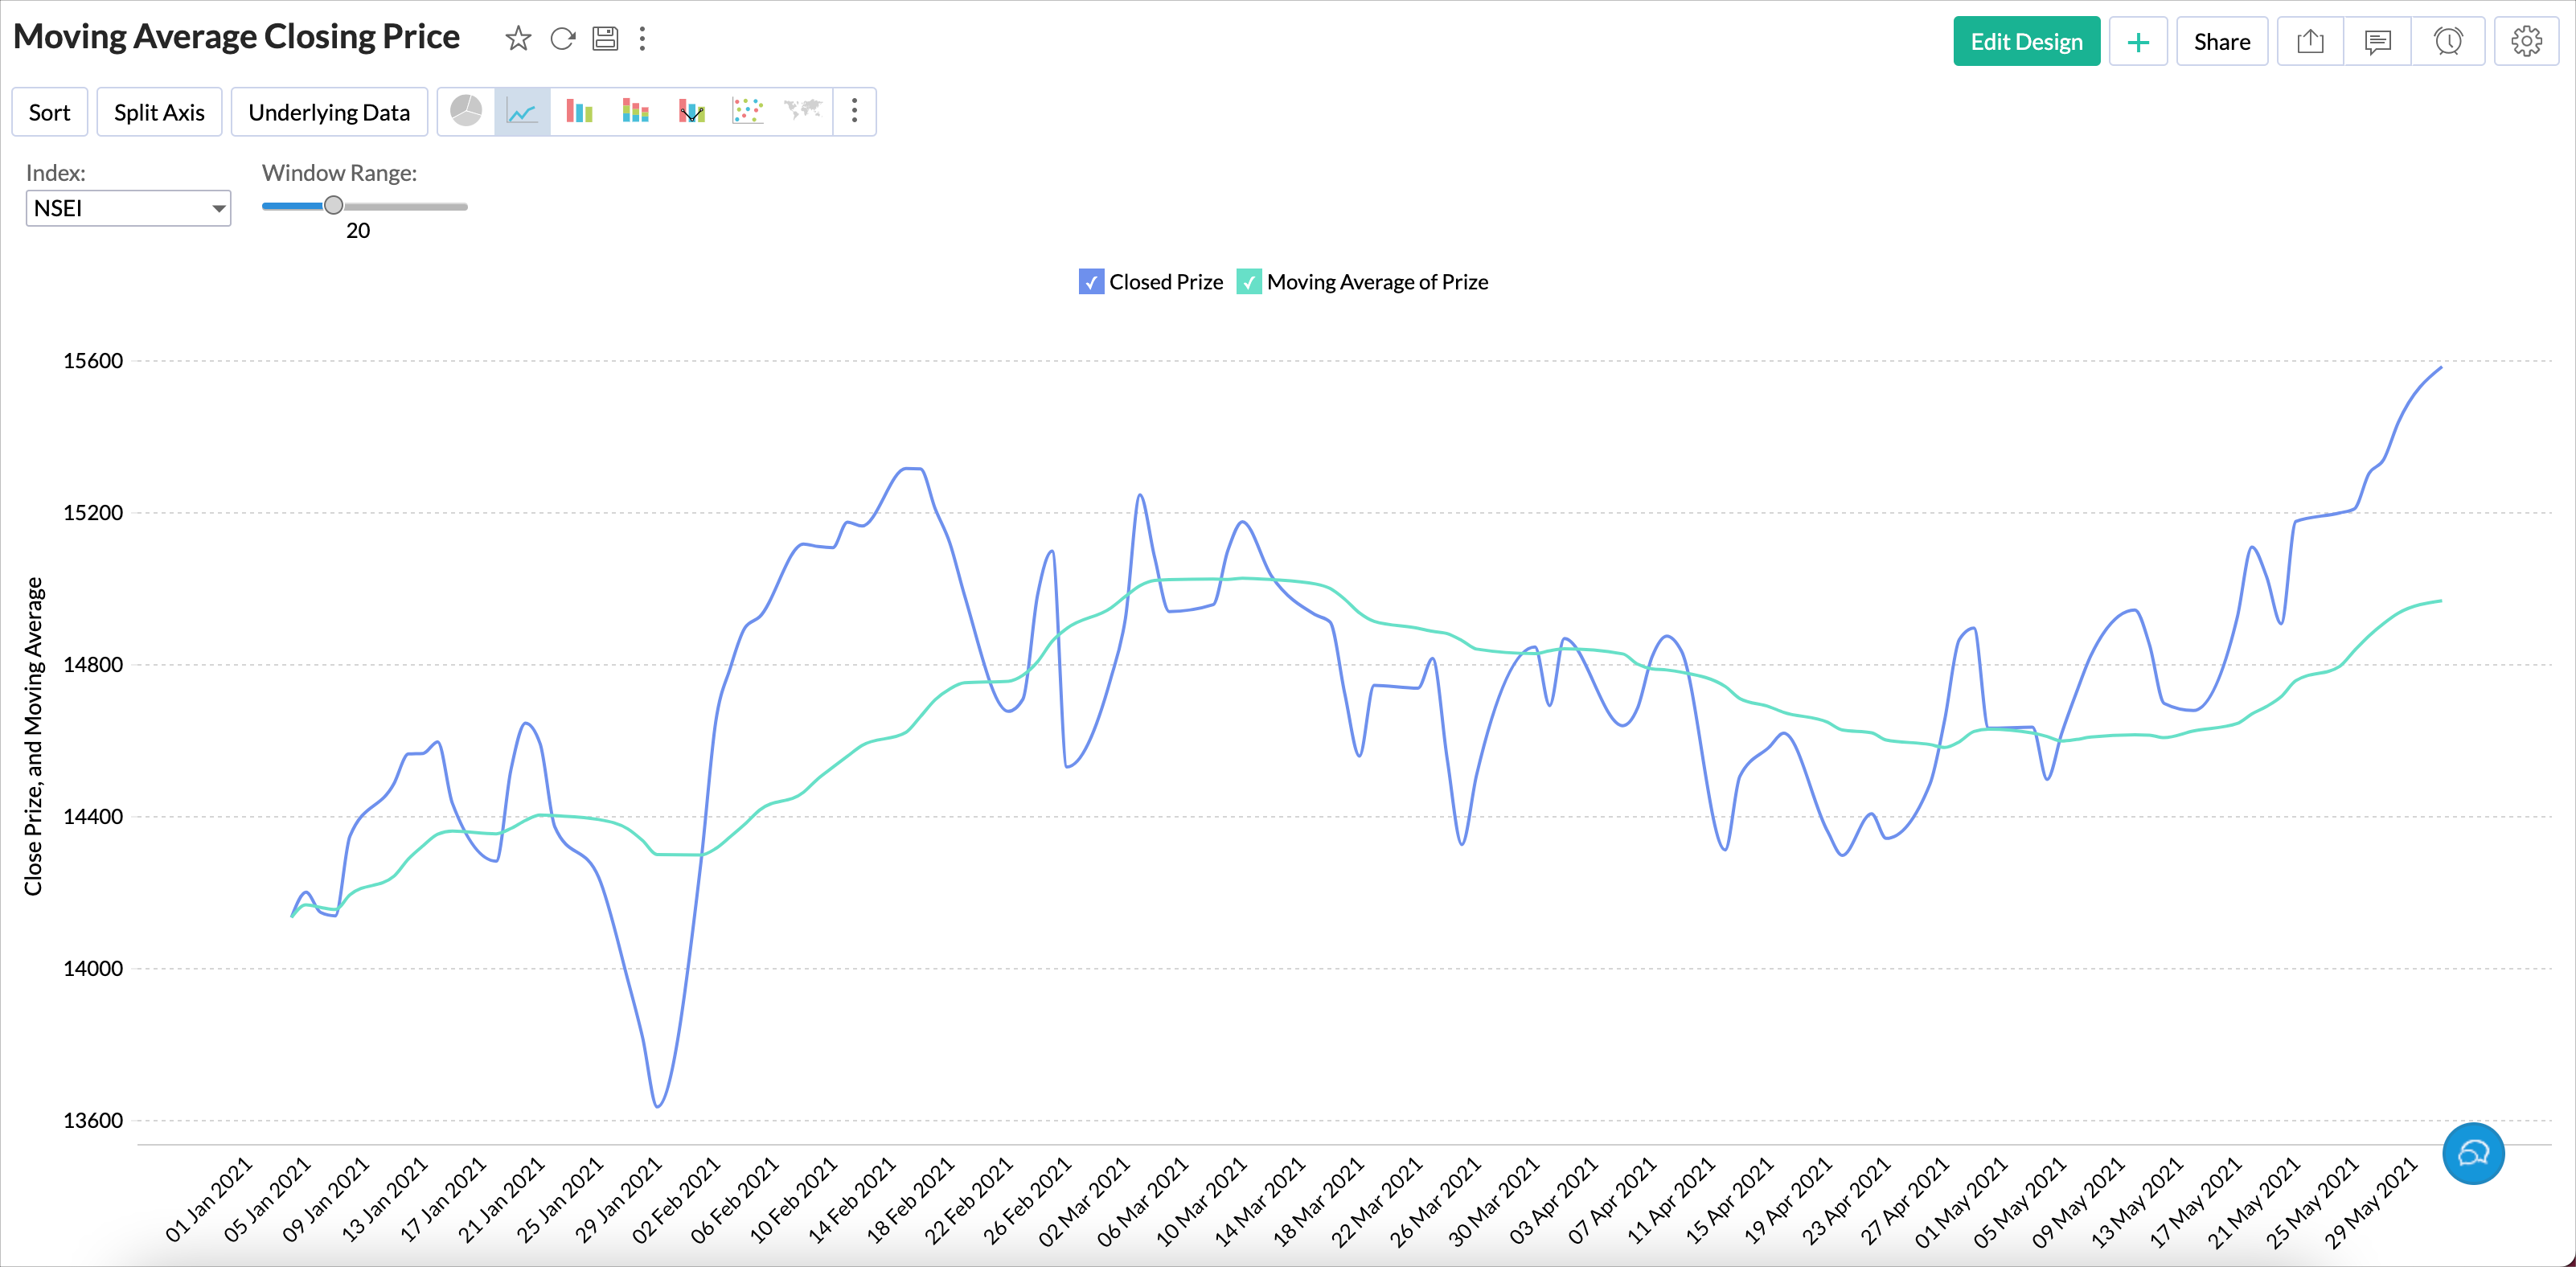
- Generate the report. Chart will plot 5 days moving average for everyday based on the variables default value.

https://analytics.zoho.com/workspace/1160261000007432001
Stay tuned to learn about more calculations.
All-in-one knowledge management and training platform for your employees and customers.
Zoho Developer Community
Topic Participants
Janani Thakshayani
German
Philip Edey
Sticky Posts
Tip of the Week - Spot Risky Sales with Conditional Formatting
In Zoho Analytics, small tweaks can lead to big insights. One such feature is Conditional formatting based on other columns, your key to instantly spotting where sales success is overshadowed by product returns. Our tip this week shows you how to apply
Zoho TeamInbox Resources
Zoho CRM Plus Resources
Zoho Books Resources
Zoho Subscriptions Resources
Zoho Projects Resources
Zoho Sprints Resources
Qntrl Resources
Zoho Creator Resources
Zoho CRM Resources
Zoho Show Resources
Get Started. Write Away!
Writer is a powerful online word processor, designed for collaborative work.
-
オンラインヘルプ
-
Webセミナー
-
機能活用動画
-
よくある質問
-
Ebook
-
-
Zoho Campaigns
- Zoho サービスのWebセミナー
その他のサービス コンテンツ
Nederlandse Hulpbronnen
ご検討中の方
Recent Topics
Default Reminder Time in New Tasks or New Event?
Any way to change this from 1:00am? Thanks, Gary Moderation Update (February 2026): With the Calendar preferences, the default reminder time for Meetings, Appointments and All-Day Meetings can be set. Read more: Calendar preferences in Zoho CRM RegardingFull Context of Zoho CRM Records for Zia in Zoho Desk for efficient AI Usage
Hello everyone, I have a question regarding the use of Zia in Zoho Desk in combination with CRM data. Is it possible to automatically feed the complete context of a CRM record into Zia, so that it can generate automated and highly accurate responses forExporting All Custom Functions in ZohoCRM
Hello, All I've been looking for a way to keep about 30 functions that I have written in Zoho CRM updated in my own repository to use elsewhere in other instances. A github integration would be great, but a way to export all custom functions or any wayDynamic Field Folders in OneDrive
Hi, With the 2 options today we have either a Dynamic Parent Folder and lots of attachments all in that one folder with only the ability to set the file name (Which is also not incremented so if I upload 5 photos to one field they are all named the sameRight Shift key not sending to Zoho Assist environments
I'm unable to use Right Shift key in Zoho environments. Zoho environments are Win10. Computer I access from is Win 11. Issue started when I changed to Win 11. Have tried: - Multiple browsers - web client AND desktop client - 3rd party mapping tools toUnable to Filter Retail Sales Orders & Need Paid/Unpaid Filter – Zoho Books
Hi Zoho Team, Recently you introduced Retail – Standard and Retail – Premium templates for Sales Orders. However, in the Sales Order module we still cannot filter or segregate Retail Sales Orders separately from normal B2B sales orders. Because of this,About Meetings (Events module)
I was working on an automation to cancel appointments in zoho flow , and in our case, we're using the Meetings module (which is called Events in API terms). But while working with it, I'm wondering what information I can display in the image where theHow can I hide "My Requests" and "Marketplace" icon from the side menu
Hello everybody, We recently started using the new Zoho CRM for Everyone. How can I hide "My Requests" and "Marketplace" from the side menu? We don't use these features at the moment, and I couldn't find a way to disable or remove them. Best regards,Introducing Workqueue: your all-in-one view to manage daily work
Hello all, We’re excited to introduce a major productivity boost to your CRM experience: Workqueue, a dynamic, all-in-one workspace that brings every important sales activity, approval, and follow-up right to your fingertips. What is Workqueue? SalesPDF Annotation is here - Mark Up PDFs Your Way!
Reviewing PDFs just got a whole lot easier. You can now annotate PDFs directly in Zoho Notebook. Highlight important sections, add text, insert images, apply watermarks, and mark up documents in detail without leaving your notes. No app switching. NoAbility to assign Invoice Ownership through Deluge in FSM
Hi, As part of our process, when a service appointment is completed, we automated the creation of the invoice based on a specific business logic using Deluge. When we do that, the "Owner" of the invoice in Zoho FSM is defaulted to the SuperAdmin. ThisHow do you do ticket add ons in Backstage?
Hi Everyone, If you wanted to have general admin tickets and allow for add ons, like camping, or car or Carbon offset. What would you do? Peace RobinFrom Zoho CRM to Paper : Design & Print Data Directly using Canvas Print View
Hello Everyone, We are excited to announce a new addition to your Canvas in Zoho CRM - Print View. Canvas print view helps you transform your custom CRM layouts into print-ready documents, so you can bring your digital data to the physical world withvalidation rules doesn't work in Blueprint when it is validated using function?
I have tried to create a validation rule in the deal module. it works if I try to create a deal manually or if I try to update the empty field inside a deal. but when I try to update the field via the blueprint mandatory field, it seems the validationPull cells from one sheet onto another
Hello all! I have created an ingredients database where i have pricing and information and i want to pull from that database into a recipe calculator. I want it to pull based on what ingredient I choose. The ingredients database has an idea and i wantHow can Data Enrichment be automatically triggered when a new Lead is created in Zoho CRM?
Hi, I have a pipeline where a Lead is created automatically through the Zoho API and I've been trying to look for a way to automatically apply Data Enrichment on this created lead. 1) I did not find any way to do this through the Zoho API; it seems likeEmails Failing with “Relaying Issues – Mail Sending Blocked” in ZeptoMail
Hello ZeptoMail Support Team, We are facing an email delivery issue in our ZeptoMail account where emails are failing with the status “Process failed” and the reason “Relaying issues – Mail sending blocked.” Issue Details Agent Name: mail_agent_iwwa FromHow does Zoho handle support operations for our EU users?
Dear Zoho users, We have some news and reminders about how we handle support operations for Zoho users in the EU Data Center. This is part of our broader commitment to ensuring GDPR compliance and providing secure data handling for all users. We'd likeSender Email Configuration Error.
Hello Team, Hope you are all doing well. We are in the process of creating the Zoho FSM environment in the UAE. When we try to add the sender email address “techsupportuae@stryker.com”, we receive the error message: “Error occurred while sending mailDifferent Task Layouts for Subtasks
I was wondering how it would be possible for a subtask to have a different task layout to the parent task.Layout Adjustment.
Hello Latha, Hope you are doing well. I wanted to check with you about adjusting the layout columns in the Service Report from the backend, as currently there is no capability for us to customize the layout from our end. Below is the output that I amLet us view and export the full price books data from CRM
I quote out of CRM, some of my clients have specialised pricing for specific products - therefore we use Price Books to manage these special prices. I can only see the breakdown of the products listed in the price book and the specialised pricing forAnyone in Australia using Zoho Books AND has their account with NAB?
Hi I have an account with both NAB and Suncorp. Suncorp transaction come in the next day however NAB transactions take 4-5 business days to appear. eg: A deposit made today in my Suncorp will be imported into Zoho tomorrow. A deposit made today to the NAB account will be imported maybe Saturday (Friday overnight). I have contacted both Zoho and NAB but noone seems to know why. I was just wondering if anyone else in Australia uses NAB and has this issue (or doesn't) maybe we could compare notes andZoho Often Lag
Desk Team, We've noticed that Desk, Creator & other apps seems to lag more these days. We often refresh multiple times.Offer already made- but I withdrew it
I made an offer letter, but made a mistake on it. I withdrew the offer but now I can't recreate the correct offer. Zoho keeps saying that "A same offer has already been made". I look in the "offers" and there are NO offers (this is the first time I'veImporting into the 'file upload' field
Can you import attachments into the file upload field. I would expect it to work the same way as attachments do, But can't seem to get it to work. Moderation Update: The option to import into File Upload and Image Upload fields has been supported. ReadLayout Rules Don't Apply To Blueprints
Hi Zoho the conditional layout rules for fields and making fields required don't work well with with Blueprints if those same fields are called DURING a Blueprint. Example. I have field A that is used in layout rule. If value of field A is "1" it is supposed to show and make required field B. If the value to field A is "2" it is supposed to show and make required field C. Now I have a Blueprint that says when last stage moves to "Closed," during the transition, the agent must fill out field A. NowWhy is the ability Customize Calls module so limited?
Why can't I add additional sections? why can't I add other field types than the very limited subset that zoho allows? Why can I only add fields to the outbound/inbound call sections and not to the Call Information section?Zoho Desk blank screen
opened a ticket from my email, zoho desk comes up blank, nothing loads. our receptionist also gets the same thing under her login on her computer. our sales rep also gets same thing on zoho desk at his home on a different computer. I tried clearing cache/history/cookies,Optimum CRM setup for new B2B business
Can some advise the most common way to setup Zoho CRM to handle sales for a B2B company? Specifically in how to handle inbound/outbound emails. I have spent hours researching online and can't seem to find an accepted approach, or even a tutorial. I havefilter on sheets mobile (iOS, iPadOS) does not work
I have this issue on every spreadsheet, whether imported or created natively in Zoho Sheets. I can use on desktop without issue: desktop screenshot on iOS the filter dropdowns are not there and there is no way to add them mobile iPadOS looks the same【Zoho CRM】商談タブへのデータインポート
Zoho使用前にエクセルで管理していた商談情報を、Zoho一括管理のため、商談タブにインポートしたいのですが、お客さまの氏名だけが紐づけられませんでした。 「Zoho CRMにインポートする項目を関連付ける」のところが画像のようになっています。 (弊社では、「姓」を「★個人データ名」という項目名に変更し、フルネームを入れて使用しています。) どのようにしたら氏名をインポートできるかご存じの方がいらっしゃいましたら、ご教示いただきたく、よろしくお願いいたします。 (投稿先が間違っていましたらご指Add Custom Reports To Dashboard or Home Tab
Hi there, I think it would be great to be able to add our custom reports to the Home Tab or Dashboards. Thanks! ChadCanva Integration
Hello! As many marketing departments are streamlining their teams, many have begun utilizing Canva for all design mockups and approvals prior to its integration into Marketing automation software. While Zoho Social has this integration already accomplished,Can't edit Segments
Happening with 2 different Zoho One environments, in different browsers. Please fix.How to integrate Zoho CRM, Zoho Forms and a WIX Web Site
Attached video demonstrates how to use Zoho Forms included in Zoho One, to design a Contact Us form to be embedded into a WIX web site and integrated into Zoho CRM.Zoho Sheet for Desktop
Does Zoho plans to develop a Desktop version of Sheet that installs on the computer like was done with Writer?Transfer ownership of files and folders in My Folders
People work together as a team to achieve organizational goals and objectives. In an organization, there may be situations when someone leaves unexpectedly or is no longer available. This can put their team in a difficult position, especially if thereConsumer Financing
Does Zoho currently have a payment gateway (such as Stripe, Square, etc) which offers financing for customers? So, let's say the estimate we give the customer is greater than what they can afford at the time, but we can sell the service now, letting themSubform edits don't appear in parent record timeline?
Is it possible to have subform edits (like add row/delete row) appear in the Timeline for parent records? A user can edit a record, only edit the subform, and it doesn't appear in the timeline. Is there a workaround or way that we can show when a userNext Page


